
Figures & data
Figure 1. Human-based control vs. algorithmic control (based on Cram & Wiener, Citation2020, p. 74).
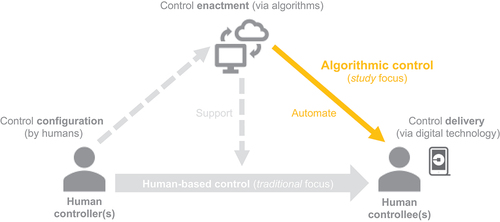
Table 1. Basic forms of algorithmic control (AC).
Table 2. Dimensions of micro-level legitimacy judgements in relation to algorithmic control (AC).
Figure 2. Research model and hypotheses.
Table 3. Hypothesis test results.
Table 4. Analysis of mediation effects.
Figure 3. Summary of study results.
Table 5. Overview of promising opportunities for future research.
Table A1. Operationalisation of focal study constructs.
Table B1. Descriptive statistics.
Table C1. Construct correlations, composite reliability (CR), and Average variance extracted (AVE).
Table C2. Cross loadings between items and constructs.
Table C3. Heterotrait-monotrait (HTMT) ratio of construct correlations.
Table D1. Assessment of CMB using partial correlation procedure (Social desirability).