Figures & data
Figure 1. CONSORT Flow diagram of the study.
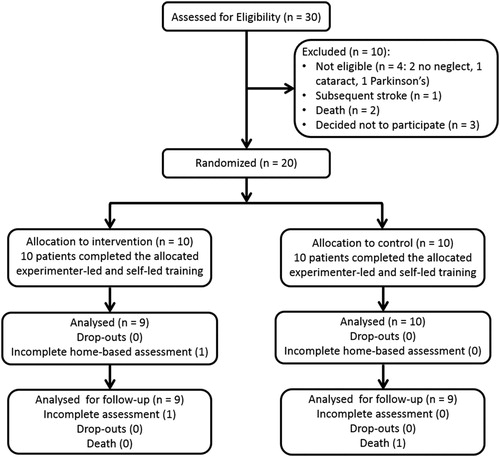
Figure 2. Grasping task performed by the intervention (A) and control (B) groups. The intervention group was asked to grasp the centre of the rod until balanced (A), whilst the control group was asked to grasp the rod at one side (B).
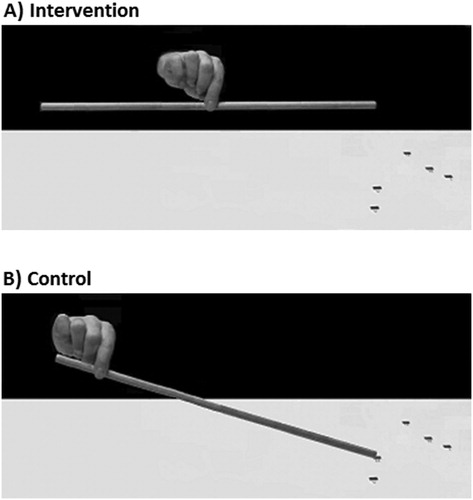
Figure 3. (A) Lesion map for individual patients. B-C) Lesion overlap map summarising the degree of involvement for each voxel in the intervention (B; N = 8) and control (C; N = 5) groups. Lesions were identified by a clinical neurologist (K.M.), who was blind to the design, group assignment and purpose of the study. Lesions were mapped onto 11 axial slices of a T1-weighted template, corresponding to the MNI z coordinates of −24, −16, −8, 0, 8, 16, 24, 32, 40, 50, 60 mm using identical or closest matching transverse slices for each patient using MRIcro software package (Rorden & Brett, Citation2000). Due to technical difficulties at the clinical facility, we were able to obtain and map digital brain scans for 13 patients only (6 MRIs and 7 CTs) as the remaining digital brain scans were either lost or corrupted. Please note however, that all brain scan reports were available and confirmed the presence of a stroke and its location for all our patients. The range of colour scale derives from the absolute number of patient lesions involved in each voxel.
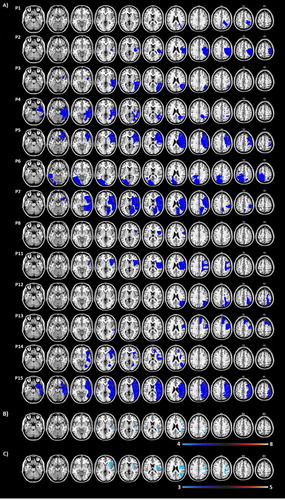
Table 1. Demographical and clinical data of 20 patients with hemispatial neglect in the 2 groups during baseline assessment before treatment.
Table 2. Statistical results for the between-group ANOVA (Intervention vs Control Group) at baseline.
Figure 4. (A) Mean absolute line bisection error (mm) per session and group. (B) Mean line bisection gain score (mm) per group. (C) Mean BIT gain score per group. (D) Mean spatial bias BIT gain score per group. Note that negative scores for this gain score denote a reduction in the ipsilesional bias (see Methods for more detail). (A-D) Error bars represent standard errors. Gain scores are based on each session vs. baseline.
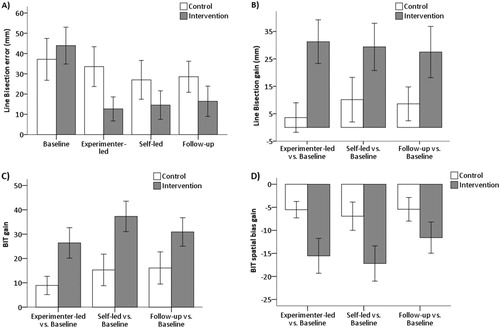
Table 3. Mean for each outcome measure per group and session (standard error in parenthesis). For details on how the scores were computed please refer to the Methods.
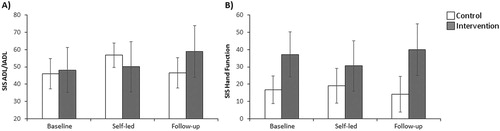
Figure 5. (A) Mean ADL/IADL SIS score per session and group. (B) Mean Hand function SIS score per session and group. (A-B) Error bars represent standard errors.