
Figures & data
Table 1. Summary of GMT studies.
Figure 1. Flow of information through the different phases of the systematic review.
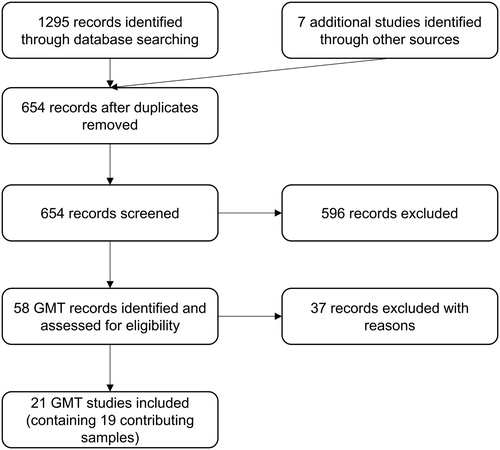
Table 2. Number of samples and number of participants according to etiology included in the meta-analysis.
Figure 2. Forest plot of studies examining everyday executive functions tasks immediately after training and at follow-up.
Solid squares = effect size of each study; size of squares = study weight (weighted by sample size); Lines = 95% confidence interval; diamond = summary effect; width of diamond = precision. TAP-A = Test of Attentional Performance Alertness, CFT = Category Fluency Test, LF = Letter Fluency, CPT = Continuous Performance Test II, CWI = Color-Word Interference Test, VF = Verbal Fluency, TMTB = Trail Making Test B, TEA = Test of Everyday Attention, SART = Sustained Attetion to Response Task, PASAT = Paced Auditory Serial Addition Test, CANTAB IST = Information Sampling Task, SOC = Stocking of cambridge, TMT = Trail Making Test, DF = Design Fluency, DV = Digit Vigilance Test, FAS = FAS Verbal Fluency Test, WCST = Wisconsin Card Sorting Test.
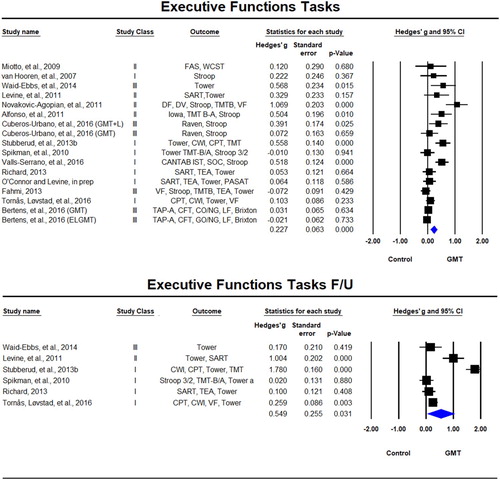
Figure 3. Forest plot of studies examining everyday executive functions tasks immediately after training and at follow-up.
Solid squares = effect size of each study; size of squares = study weight (weighted by sample size); Lines = 95% confidence interval; diamond = summary effect; width of diamond = precision. MSET = Modified Six Elements Test, BADS = Behavioural Assessment of the Dysexecutive Syndrome, MET = Multiple Errand Test, R-SAT = Revised Strategy Application Test, UPSA = UCSD Performance-Based Skills Assessment, MET-CV = Multiple Errands Test − contextualised version, VPT = Virtual Planning Test, SRLT = simulated real-life tasks.
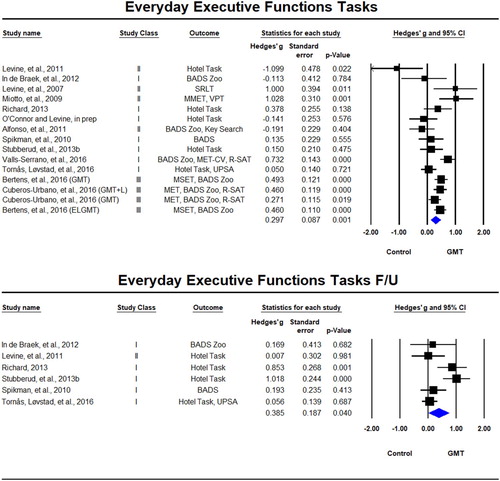
Figure 4. Forest plot of studies examining subjective ratings of executive functions by patient immediately after training and at follow-up.
Solid squares = effect size of each study; size of squares = study weight (weigthed by sample size); Lines = 95% confidence interval; diamond = summary effect; width of diamond = precision. EFI = Executive Function Index, EOS = Executive Observation Scale, CFQ = Cognitive Failures Questionnaire, DEX = Dysexecutive Questionnaire, BRIEF-A = Behavior Rating Inventory of Executive Function – Adult, GMT-Q = Goal Management Training Questionnaire.
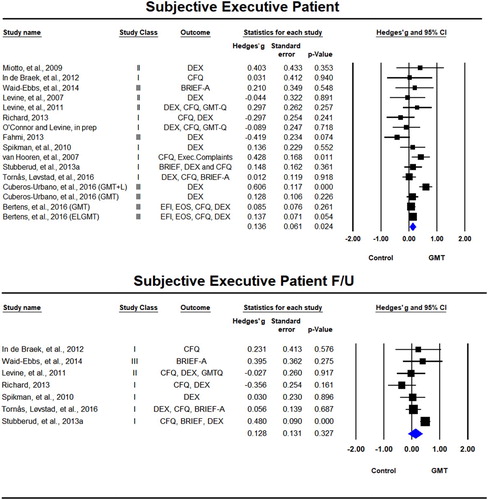
Figure 5. Forest plot of studies examining subjective ratings of executive functions by proxy immediately after training and at follow-up.
Solid squares = effect size of each study; size of squares = study weight (weigthed by sample size); Lines = 95% confidence interval; diamond = summary effect; width of diamond = precision. EOS = Executive Observation Scale, CFQ = Cognitive Failures Questionnaire, DEX = Dysexecutive Questionnaire, BRIEF-A = Behavior Rating Inventory of Executive Function – Adult, GMT-Q = Goal Management Training Questionnaire. *rated by both spouse/caregiver and therapist.
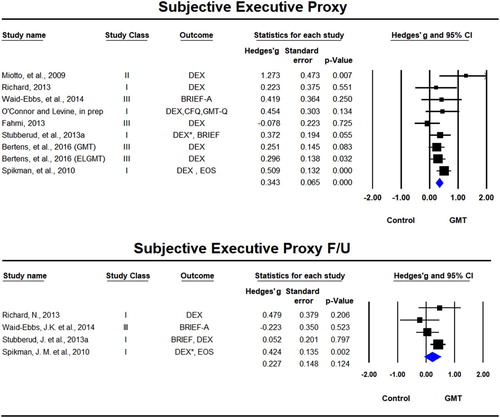
Figure 6. Forest plot of studies examining working memory and speed of processing immediately after training.
Solid squares = effect size of each study; size of squares = study weight (weigthed by sample size); Lines= 95% confidence interval; diamond = summary effect; width of diamond = precision. SOPT = Self-Ordered Pointing Test, CT = Consonant Trigrams, DS = Digit Span, LNS = Letter Number Sequencing, AS = Arithmetic Span, TMT = Trail Making Test, VAT = Visual Attention Test, DSMT = Digit Symbol Modalities Test.
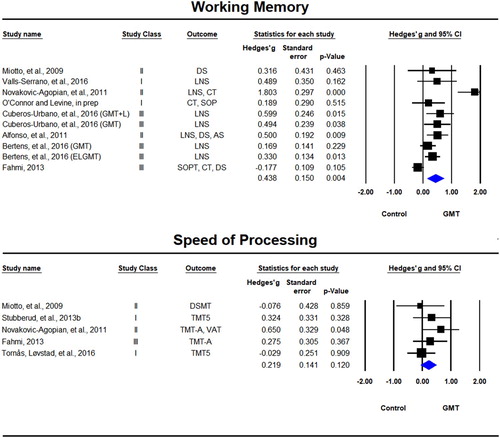
Figure 7. Forest plot of studies examining Instrumental Activities of Daily Living (iADL) immediately after training and at follow-up.
QOLIBRI = Quality of Life after Brain Injury, GAS = Goal attainment scaling, RRL = Role Resumption List, CIBIC-Clinician’s Interview-Based Impression of Severity and Change.
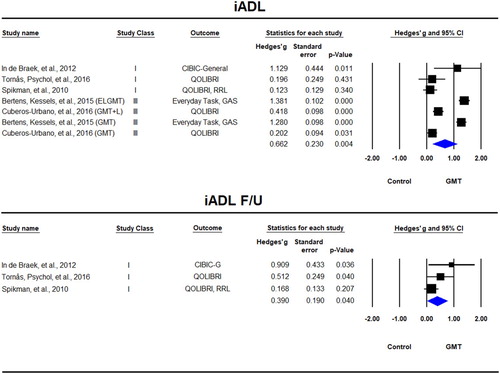
Figure 8. Forest plot of studies examining mental health status immediately after training and at follow-up.
SF-36 = The Short Form (36) Health Survey, HSCL-25 = Hopkins Symptom Checklist, BREQ = The Brain Injury Rehabilitation Trust Regulation of Emotions Questionnaire, PSS = Perceived Stress Scale, SCL-90 = Symptom Check List–90, POMS TMD = Profile of Mood States Total Mood Disturbance.
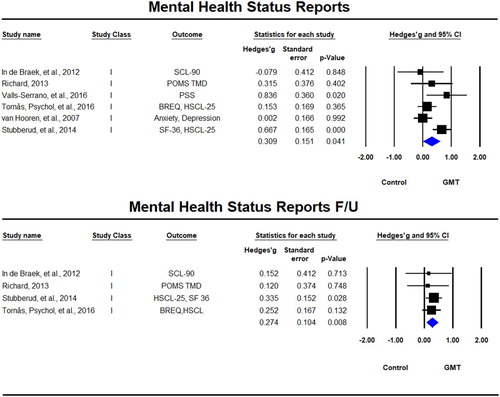
Figure 9. Forest plot of studies examining memory immediately after training. RBMT = Rivermead Behavioural Memory test; DR = Delayed Recall, IR = Immediate Recall; LM = Logical Memory; BVMT = Brief Visuospatial Memory Test, HVMT = Hopkins Verbal Learning Test.
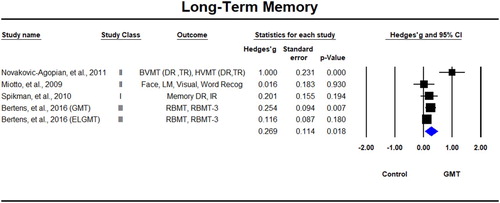
Table 3. Summary of effect sizes across cognitive measures domains.
Table 4. Meta-regression analyses.
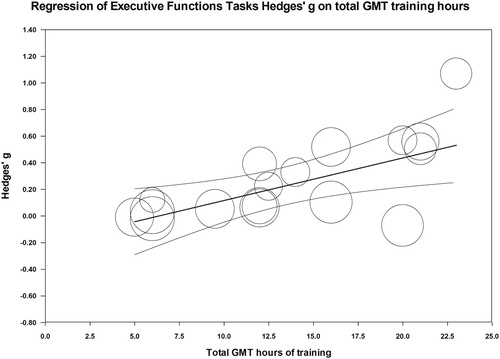
Figure 10. Relationship between GMT treatment hours and effect size in Executive Function Tasks.
GMT = Goal Management Training; Ctrl = Control, f/u = follow up; subj.= subjective, ICU = Intensive Care Unit; TBI = Traumatic Brain injury; ABI = Acquired Brain injury; ADHD, Attention Deficit Hyperactivity Disorder, MS = Multiple Sclerosis, SUD = Substance Use Disorder; CVD = Cerebrovascular Disease.