Figures & data
Table 1. Demographic and clinical characteristic of participants.
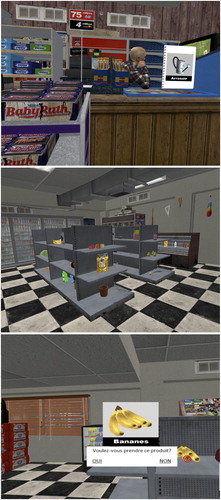
Figure 1. The Virtual Shop. Image A shows the notepad on the countertop, on which items appeared during the encoding phase, after which the cashier would talk to the participant as a filled interference delay. Image B shows a version of the Virtual Shop, with the items placed on the shelves and hung to the walls. Finally, Image C shows an item that has been selected by the participant with the remote control.