
Figures & data
Figure 1. Lesion overlays for 10 of the 23 patients in the study, for whom scans were available. These show the foci of the lesions in frontal, parietal and temporal cortices in the right hemisphere.
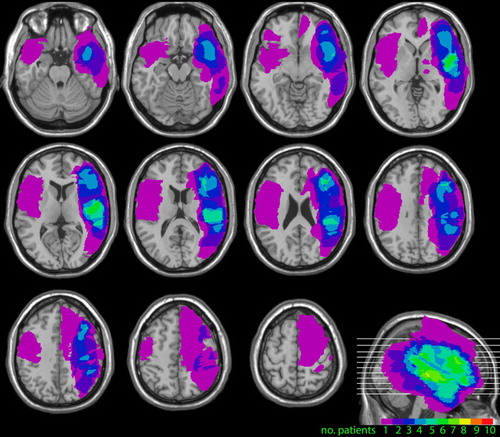
Figure 2. Mean (± S.E) performance on the training tasks over the twenty days of training for (A) WMT and (B) SAT groups respectively
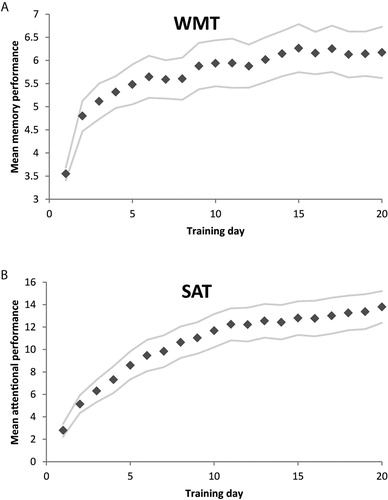
Figure 3. Mean (± S.E) change in performance from pre-test to post-test for the experimental measures in each of the groups. Plots show performance for; A. change in TVA absolute bias, B. change in K’, C., K variability, D. change in a number of targets cancelled by side on the star cancellation task and E. change in Dot Matrix performance. An * above the bar denotes that that group is a significant (p < .05) predictor of the post-test score. An * to the left of a bar indicates a significant (p < .05) change in test performance between pre and post-test, as measured by paired sample t-tests.
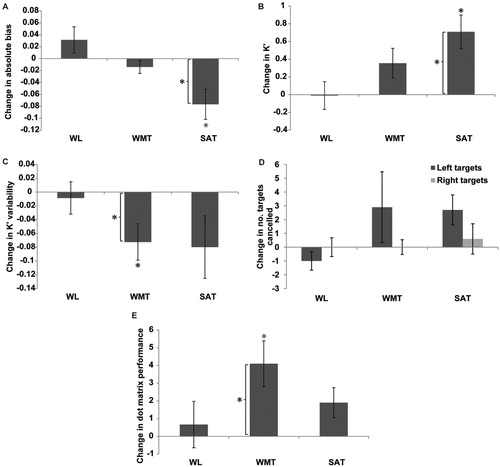
Figure 4. Change in self-reported functioning as measured by the EBIQ from pre-test to post-test. Formal statistical testing was only completed for EBIQ cognitive and EBIQ core symptoms. For these measures, an * above the bar denotes that that group is a significant (p < .05) predictor of the post-test score, whilst an * to the left of a bar indicates a significant (p < .05) change in test performance between pre and post-test, as measured by paired sample t-tests. Please note formal to reduce the number of test carried out, formal statistical analyses were only carried out on EBIQ cognitive and EBIQ core sub-scales, the significance of the other subscales has not been tested.
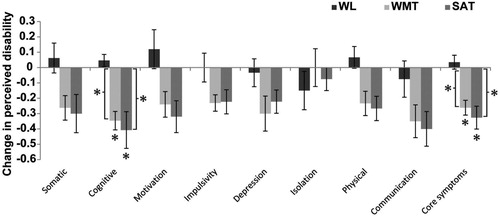
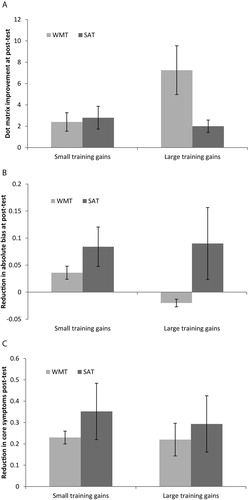
Figure 5. Mean (±S.E.) changes in performance for patients who made small and large training gains (based on a median split) as a function of training type. A. Dot Matrix task. B. Absolute spatial bias. C. EBIQ core symptoms.