
Figures & data
Figure 1. Consort diagram showing the identification of participants in the study.
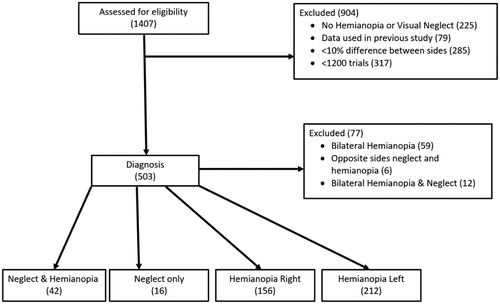
Figure 2. Mean visual search times (VST) in seconds into the affected (dark grey) and unaffected (light grey) fields for the four patient groups over the four time points (BL = baseline; T1, T2 and T3 = Time points 1, 2 and 3). The three groups where the post hoc tests demonstrated a main effect of Therapy in are shown with a *.
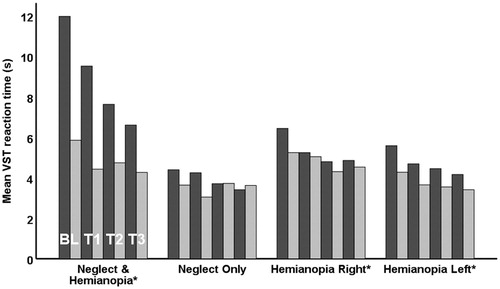
Table 1. The unstandardized (raw percentage change) and standardized (Cohen’s d) effect sizes.
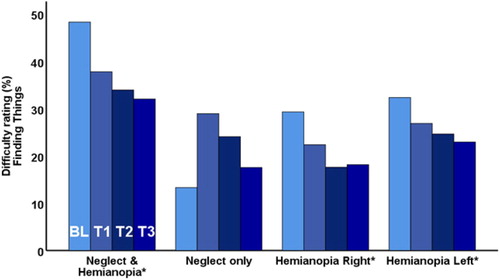
Figure 3. Mean self-reported difficulty ratings (Finding Things) for the four patient groups over the four time points (BL = baseline; T1, T2 and T3 = Time points 1, 2 and 3). The three groups where the post hoc tests demonstrated a main effect of Therapy in are shown with a *.
Data availability statement
An anonymized version of the behavioural data and basic demographic variables (that preserves subject anonymity) are available from the PI, Professor Alex Leff ([email protected]), ORCID id: 0000-0002-0831-3541.