Figures & data
Figure 1. Reproduced with permission from Baker (Citation2012).
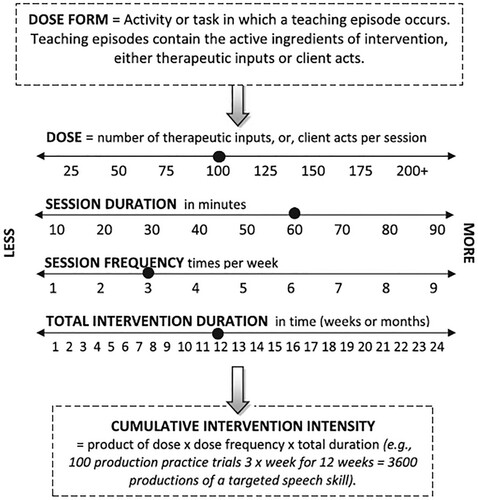
Table 1. Dosage related measures and possible active ingredients.
Table 2. Formulas used for calculating measures.
Table 3. Inter-rater reliability results using ICC calculation.
Table 4. Intra-rater reliability results using ICC calculation.
Table 5. Participant demographic and stroke characteristics.
Figure 2. Frequency data of session number included in the sample.
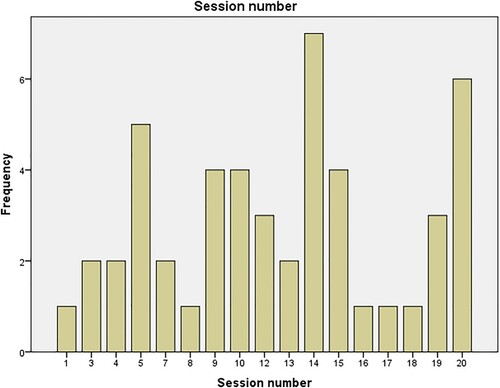
Figure 3. Recovery trend on the WABR-AQ based on baseline severity.
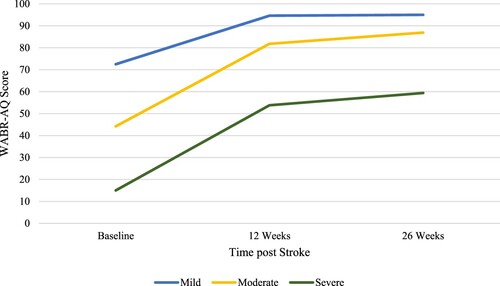
Table 6. Tasks completed in therapy videos.
Table 7. Session duration in minutes.
Table 8. Dosage (Client Acts) Descriptive Statistics.
Table 9. Dosage (Therapist Inputs) Descriptive Statistics.
Table 10. Dosage (client acts) descriptive statistics, (mean (SD)) and group comparisons by aphasia severity.
Table 11. Dosage (therapist inputs) descriptive statistics (mean (SD)) comparisons by aphasia severity.
Table 12. Linear regression of dose (client acts and therapist inputs) with patient outcome at 12 weeks post stroke.
Table 13. Linear regression of dose (client acts and therapist inputs) with patient outcome at 26 weeks post stroke.
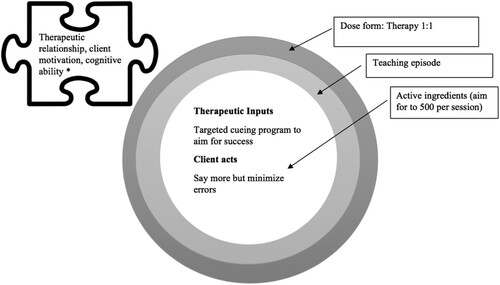
Figure 4. Calculation of cumulative intervention intensity as per Warren et al. (Citation2007) concepts.
Numbers presented in parentheses are the mean values from the sample.
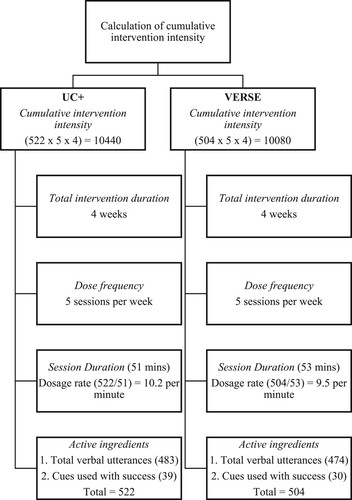
Figure 5. Adapted from Baker (Citation2012), the relationship between dose form, teaching episodes and active ingredients.