Figures & data
Figure 1. Flowchart depicting respondents’ pathway through the survey.
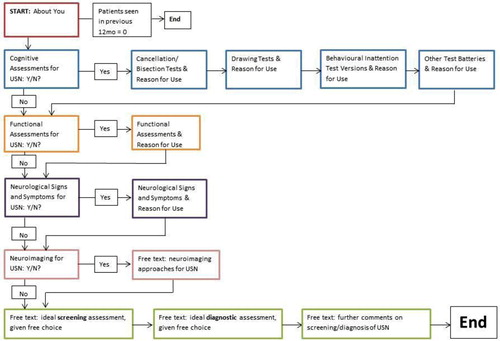
Table 1. Characteristics of respondents.
Figure 2. Percentage of respondents from each professional group who use each category of neglect assessment.
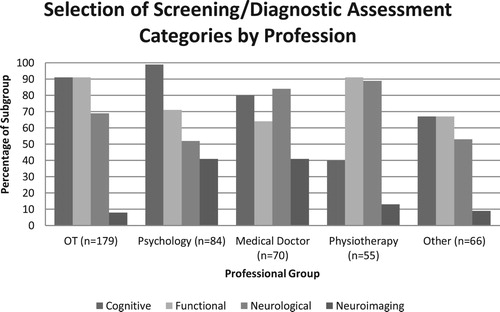
Figure 3. Number of respondents from each country who indicate their use of each category of neglect assessment.
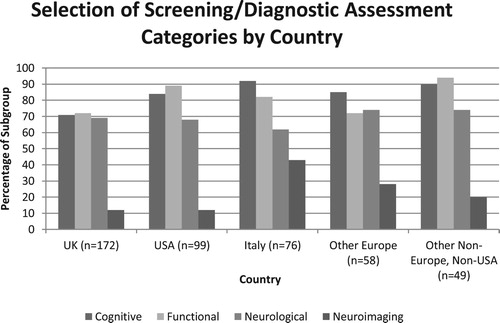
Figure 4. Forest plots depicting logistic regression results for selection of each assessment category. Note: x-axes are on a logarithmic scale. Logistic regression results are presented as odds ratios with 95% confidence intervals.
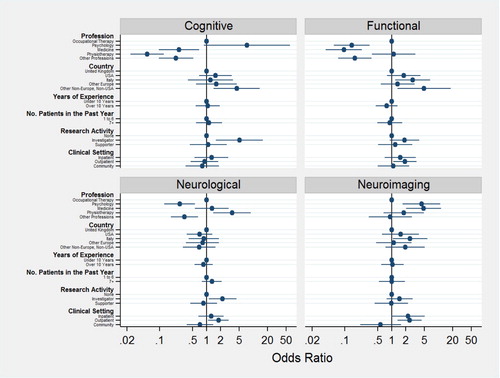
Figure 5. Cognitive assessment selections by professional group (5A) and by country (5B).
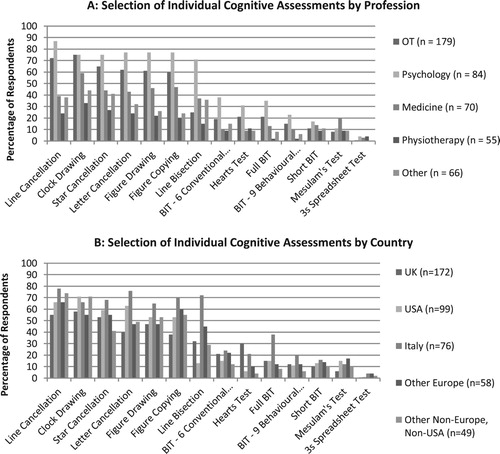
Figure 6. Functional assessment selections by professional group (6A) and by country (6B).
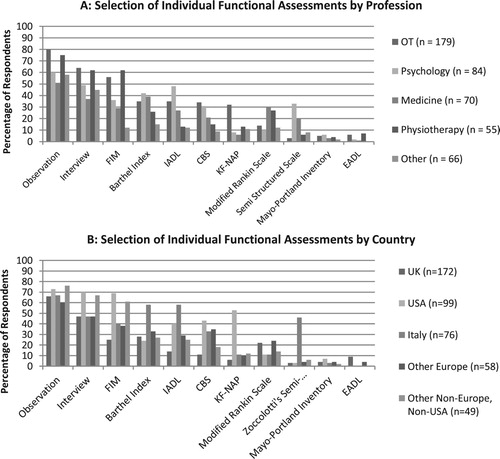
Figure 7. Neurological assessment selections by professional group (7A) and by country (7B).
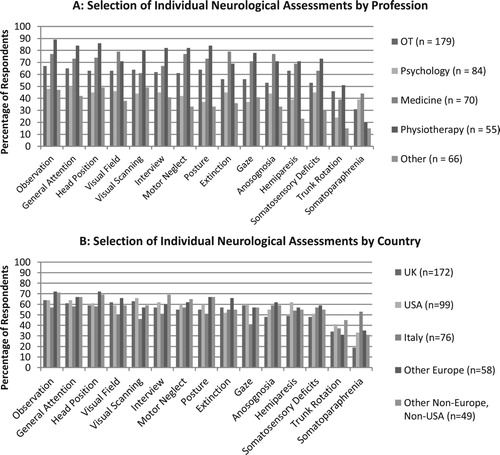
Figure 8. Reported neuroimaging/neuromodulation techniques by professional group (8A) and by country (8B).
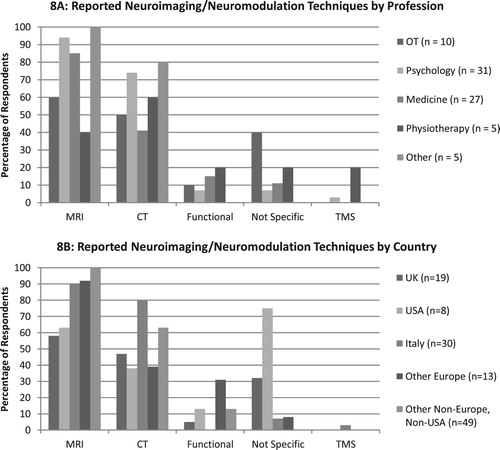
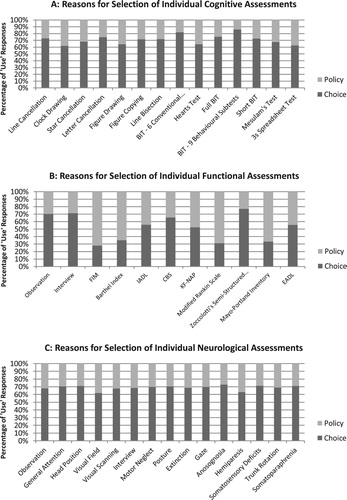
Figure 9. Proportions of “use” responses according to reason for selection – institutional policy or professional choice.