
Figures & data
Table 1. Demographic and clinical data.
Figure 1. Percentage of childhood cancer (CC) survivors and controls with performance below the normative range in cognitive domains. The dotted line indicates the cut-off of the percentage of survivors expected to perform below the normative range according to the Gaussian distribution.
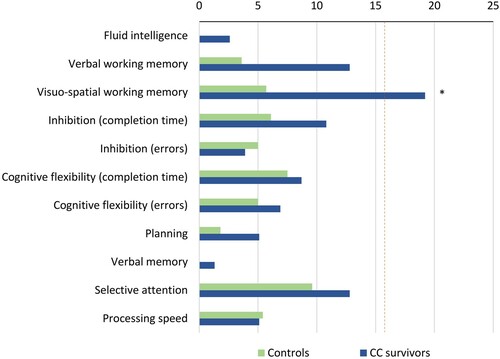
Table 2. Cognitive functions.
Table 3. Psychosocial functions and health-related quality of life.
Figure 2. Percentage of childhood cancer (CC) subgroups with performance below the normative range in cognitive domains. The dotted line indicates the cut-off of the percentage of survivors expected to perform below the normative range according to the Gaussian distribution.
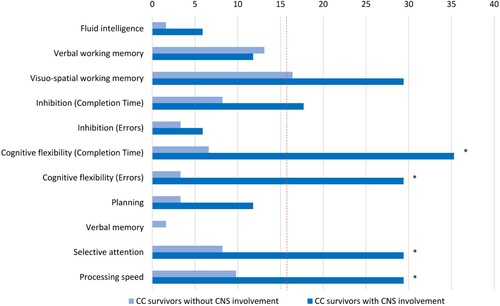
Table 4. Cognitive functions of childhood cancer subgroups.
Supplemental material
Supplemental Material
Download PDF (663.1 KB)Supplemental Material
Download PDF (546 KB)Supplemental Material
Download PDF (518 KB)Data availability statement
All data of this study are available upon reasonable request after signing a confidentiality statement and a data sharing agreement.