
Figures & data
Figure 1. Lesion overlap maps for neglect and non-neglect patient groups.
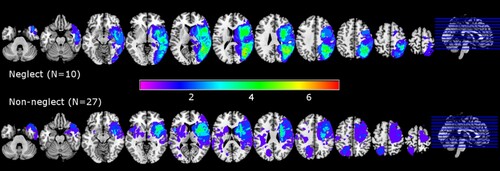
Table 1. Demographic information of study participants. MOCA values are out of a total possible score of 30. Values are given as mean (SD). L/RHD = left/right hemisphere damage.
Table 2. Behavioural results from the Bells and Apples cancellation tasks, line bisection, and manual exploration task. L-R refers to the difference in omission counts on the left minus the right half of the sheet, with positive values indicating left-sided neglect. CoC refers to the center of cancellation metric representing the average horizontal position of correctly identified targets, on a scale from −1 (right neglect) to 1 (left neglect). Manual mean x position refers to a similar metric based on the average horizontal location of all taps during the manual exploration task. Manual left percent refers to the amount of time spent exploring the left half of the screen, with values below 50% indicating a left-sided neglect. Values are given as mean (SD). L/RHD = left/right hemisphere damage
Figure 2. Example of manual exploration patterns for a healthy control and a neglect patient exhibiting a strong rightward bias. The blue trace shows the path made by the participant based on the position of each recorded tap. Hidden targets were randomly distributed one at a time across the screen, and search time was limited to 40 sec per target before positive feedback was given and the target moved to a new location.
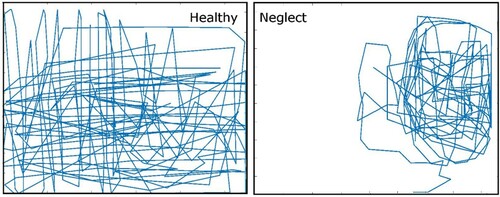
Figure 3. Percentage of taps located within each of five columns across the horizontal span of the screen for each of the three groups. * indicates a significant between-group difference (p<.05).

Table 3. Statistical values from patients with significant differences in the single case analyses compared to healthy controls for the percent of time exploring the left half of the screen, the percentage of taps in the far left column, and the normalized mean horizontal position on the manual exploration task. The z-score corresponds to an effect size estimate for a case control study (Crawford et al., Citation2010) and p-values are based on one-tailed tests.
Figure 4. Normalized mean horizontal position in the manual exploration task by group (left) and compared to the Bells task center of cancellation for both patient groups (right).
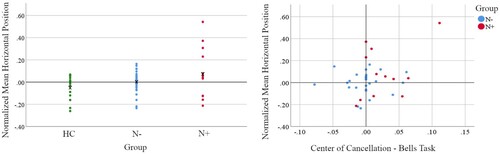
Figure 5. Association between the deviations from midline in the line bisection task (5 and 20 cm versions) and the manual exploration normalized mean horizontal position in both patient groups.
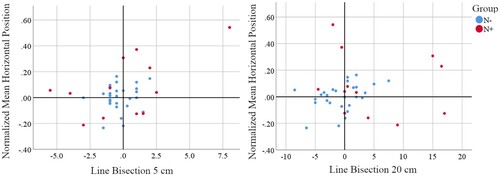
Table A1. Bold values indicate below threshold performance for Line Bisection, Apples Test L-R Omissions, Apples Test L-R False Positives, Bells Test L-R Omissions, Scene Copying Score, Clock Drawing Score, Reading L-R Omissions, and Writing Margin.
Table A2. Bold values indicate below threshold performance for the Catherine Bergego Scale, EENC Total (Évaluation écologique de la négligence corporelle Allart et al., Citation2016) and Tangled Figures L-R Omissions.