Figures & data
Figure 1. Flowchart outlining the design and progress of the trial. The outcome measures presented to the persons with TBI include BRIEF-A, QOLIBRI and BDI-II. *The subjective feedback was received from 20 persons with TBI (AB: n = 12 and BA: n = 8). (Overall N in the study differs from Siponkoski et al. (Citation2020) because one subject who participated in the cognitive measurements failed to return questionnaire data and was excluded from the present study).
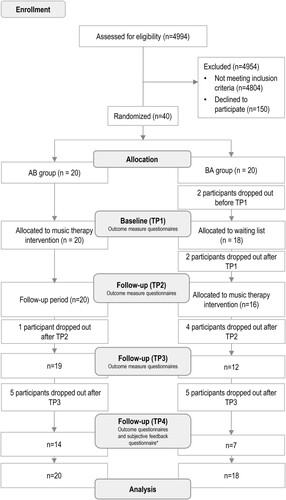
Table 1. Demographic, clinical and musical background information of the persons with TBI.
Table 2. Demographic background information of the caregivers. P-values for group differences (AB/BA) are presented under the title.
Figure 2. Results from the intention-to-treat (ITT) analysis BRIEF-A Behavioral Regulation Index. The bar plots (mean ± SEM) show changes in test scores over TP1-TP3 presented group-wise (AB/BA) from the imputed data set (depicting the mean of 20 imputations). Significant Time × Group interaction is shown with solid gray line and significant within-group Time main effects are shown with dashed gray lines. SEM, standard error of the mean.
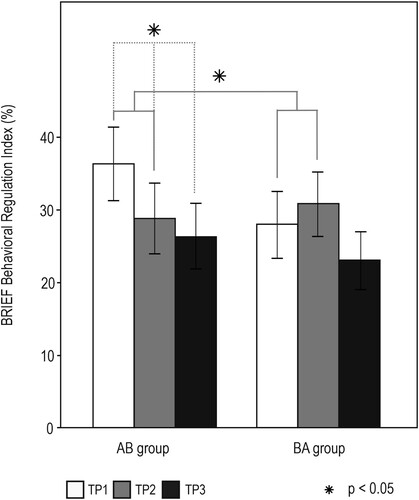
Table 3. Linear mixed model analysis (LMM) results between time points 1–2 using the complete dataset (persons with TBI: n = 38, caregivers: n = 33), means and standard deviations are based on means of the imputed datasets. All of the results are presented in percentages compared to the maximum score. The baseline differences have been evaluated using independent samples t-test (t).
Table 4. Subjective evaluations regarding the efficacy of the intervention in five different domains, as rated by the persons with TBI and caregivers. A numeric scale 1 – 10 (no benefit – very beneficial) was applied. The differences between the estimates of caregivers and persons with TBI have been assessed using paired sample t-test.
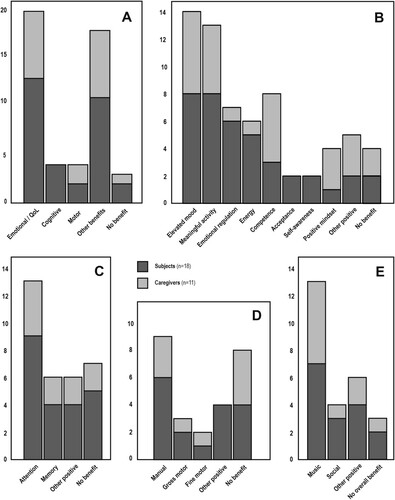
Figure 3. Findings from the qualitative content analysis presenting the amount of subjects’ and caregivers’ answers belonging to different categories (A) presents overall benefits as categorized into preset themes. B-E depict quantification of all answers across the sample belonging to the following themes: (B) Mood and Quality of life, (C) Cognitive; (D) Motor (E) Other benefits. Only one mention belonging to the same category per subject/caregiver was taken in account in the quantification.