
Figures & data
Figure 1. Factors that may affect the provision of speech therapy, and recovery and response to therapy.
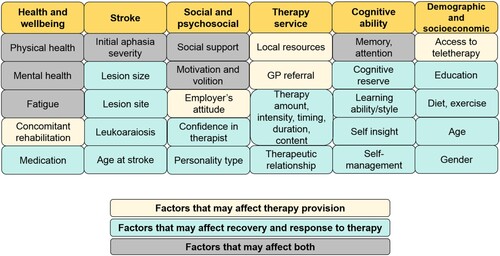
Table 1. Patient characteristics.
Table 2. Questions asked to participants about their speech and language therapy.
Figure 2. Amount of early therapy (hours) reported by each patient, according to whether the initial severity of symptoms was Severe or Moderate.
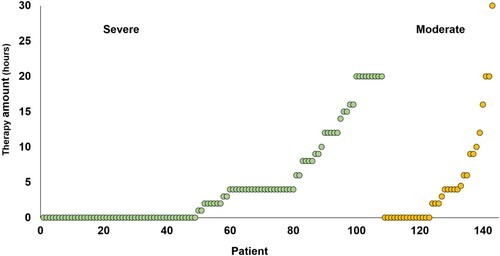
Table 3. Outcomes in 143 patients who reported (i) whether they did versus did not receive early therapy and (ii) varying amounts of early therapy.
Table 4. Outcomes in patients who reported (i) whether they did versus did not receive early therapy and (ii) varying amounts of early therapy, with outliers removed from analyses.
Figure 3. Degree of improvement from one week to one month, and one month to one year, according to five different patient-reported therapy amounts. The colour of the bar indicates the degree of improvement: Purple = no change in score, green = a change of one (e.g., Severe to Moderate, Moderate to Mild), orange = a change of two (Severe to Mild, Moderate to Normal) and grey = a change of three (Severe to Normal).
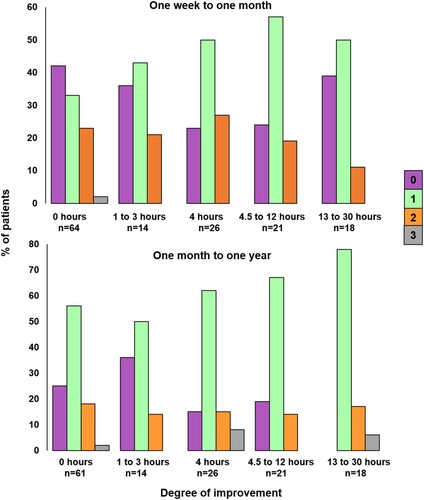
Figure 4. Degree of improvement for four patient groups with either Severe or Moderate initial severity, and who reported either no early therapy or more than 4 h of early Therapy.
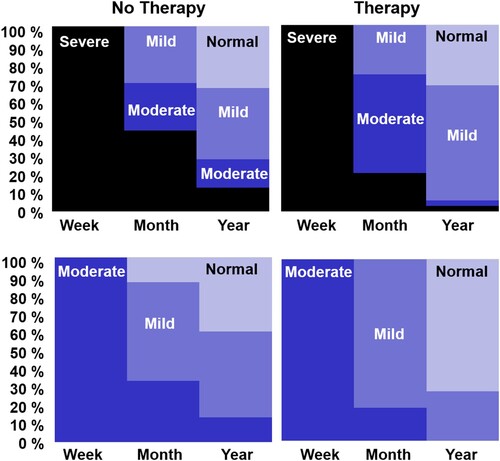
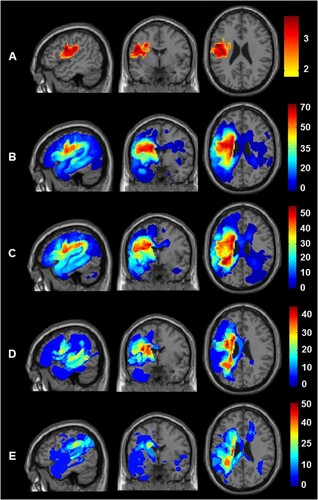
Figure 5. Comparison of lesion sites across the four different groups. Lesion site results after assigning the 143 patients to four groups according to initial severity (Severe versus Moderate) and the provision of therapy (Yes versus No). Top row (A) shows the brain regions where damage was significantly greater in those with Severe versus Moderate initial severity. The sagittal, coronal and axial slices are at the co-ordinates of the most significant group difference (−48, −2, +24). Rows B to E show the lesion overlap maps (showing the frequency of damage) for the four groups at the same co-ordinates. From top to bottom, B) Patients with Severe initial severity who received Therapy (n = 59); C) Patients with Severe initial severity who did not receive therapy (n = 49); D) Patients with Moderate initial severity who received Therapy (n = 20); E) Patients with Moderate initial severity who did not receive therapy (n = 15). The colour scale indicates percentage of patients for each group.
Supplemental Material
Download PDF (125.6 KB)Data availability
The data used in this study are stored in the PLORAS database (Seghier et al., Citation2016).