
Figures & data
Figure 1. CONSORT diagram showing flow of patients through the study.
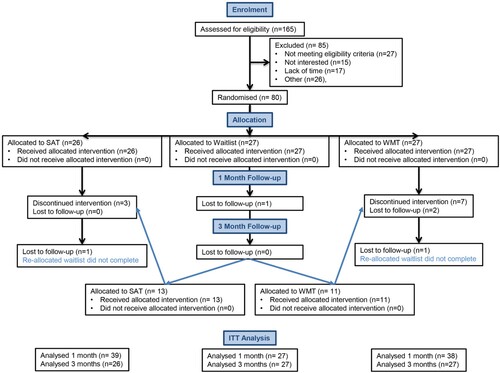
Table 1. Comparison of the three groups on background measures and self-reported symptom severity at baseline.
Table 2. Participant performance on baseline measures of cognitive function.
Figure 2. Mean daily performance on the training tasks over the 20 training sessions. (A) shows average performance of the SAT patients (collapsed across the five training tasks which made up each session) whilst (B) shows the avarage performance of the WMT patients (collapsed across the 4 training tasks they completed at each session).
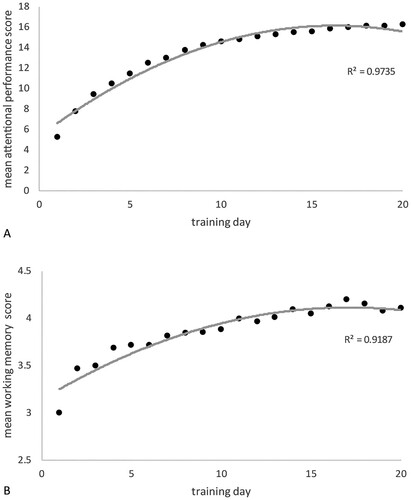
Figure 3. Mean (±S.E) ratings of (A) the helpfulness and (B) the enjoyableness of SAT and WMT over the 4 weeks of training.
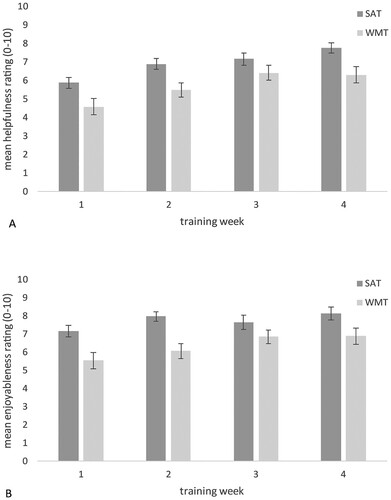
Table 3. The results of the regression analyses of the secondary end-points.
Figure 4. Mean ± S.E. Patient rating of change in symptoms compared to the previous week across 8 key areas, for (A) SAT, (B) WMT and (C) WL.
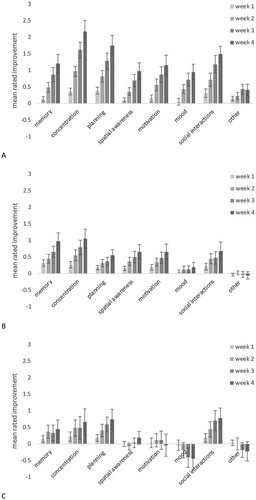
Table 4. The results of the regression analyses at 3 months post training.
Data availability statement
The data are freely available at https://doi.org/10.17863/CAM.66310.