Figures & data
Figure 1. Clinical treatment targets. The red ring shows the first target over the superior part of the occipital cortex with only minimal effects of transcranial magnetic stimulation and the yellow ring shows the subsequent target over the inferior part where symptom relief was achieved.
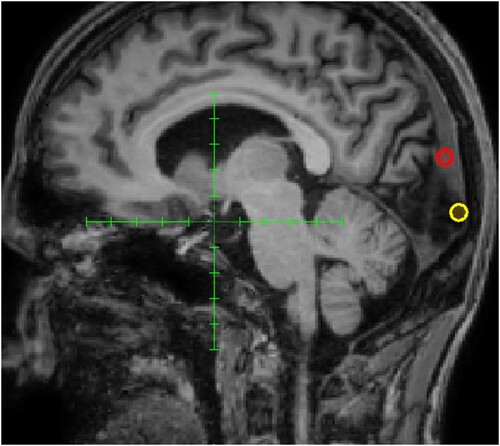
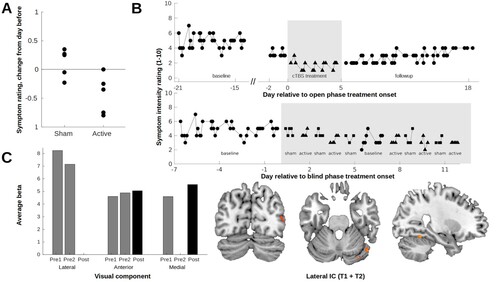
Figure 2. (A) Change in symptom intensity ratings as a function of treatment condition during the blind phase. To take into account an overall accumulative effect, each data point represents the mean rating for the corresponding day minus the mean rating for the previous day. (B) Upper: Symptom intensity ratings plotted as a function of time for the baseline period, open phase, and subsequent follow-up. The gap in the X-axis reflects the blind phase. Thus, the last few baseline data points correspond to the weekend following the blind phase. Lower: Symptom intensity ratings for the blinded phase, including the same initial baseline period as the plot above. (C) Comparison of each visual component between healthy controls and the patient for each of the three time points (two baseline sessions and one post cTBS session). Left: For components with a significantly greater activation in the patient compared to controls, bars represent the average beta across voxels for each component and time point (components with no difference in activation are not represented). Right: The differences between controls and the patient across baseline sessions in the lateral component are overlayed on an anatomical image. Increased activity in the patient is observed in the middle and inferior occipital gyri, middle temporal gyrus, fusiform gyrus, and cerebellum anterior lobe in the right hemisphere.