Figures & data
Figure 1. Normalized performance scores across cognitive tasks Higher scores on the POMP scale indicate better performance. MC = motor control; SRT = simple reaction time; CRT = choice reaction time; TD = target detection; PAL = paired associates learning; trails = trail making B-A; EMD = emotional discrimination; EMC = emotional control.
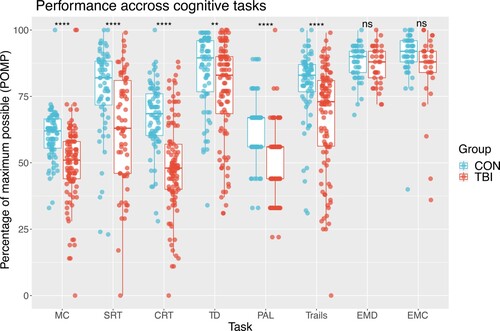
Figure 2. Rating of confidence of task performance. MC = motor control; SRT = simple reaction time; CRT = choice reaction time; TD = target detection; PAL = paired associates learning; trails = trail making B-A; EMD = emotional discrimination; EMC = emotional control.
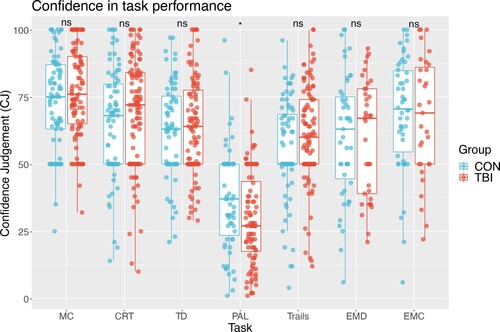
Figure 3. Metacognitive accuracy across cognitive tasks. Discrepancy was calculated using the difference between confidence judgment and task performance. Values closer to 100, indicate overestimation of performance, while values closer to −100 indicate underestimation. Dotted lines represent group pooled metacognitive accuracy. MC = motor control; SRT = simple reaction time; CRT = choice reaction time; TD = target detection; PAL = paired associates learning; trails = trail making B-A; EMD = emotional discrimination; EMC = emotional control.
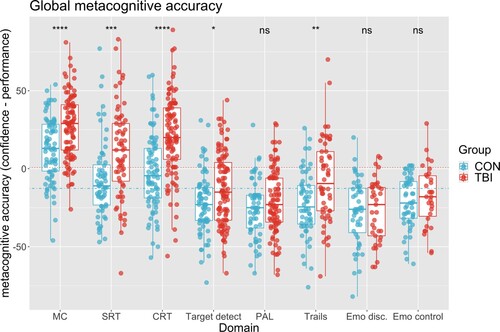
Figure 4. Relationship of general prospective ratings of memory and attention with task performance.
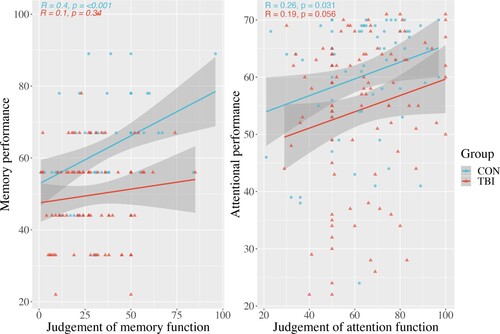
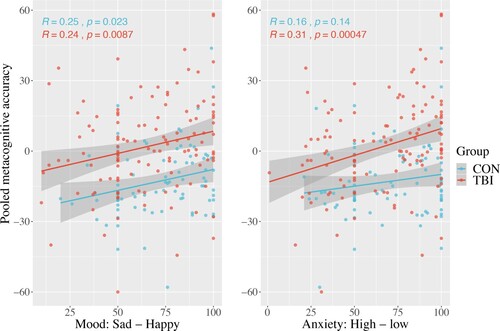
Figure 5. Pooled metacognitive accuracy and measures of mood and anxiety. Lower values on x-axis indicate low mood and higher anxiety, while larger values are associated with better mood and low anxiety.