
Figures & data
Table 1. Cognitive domains, emotional symptoms and used tests.
Figure 1. Flow chart of the study participants.
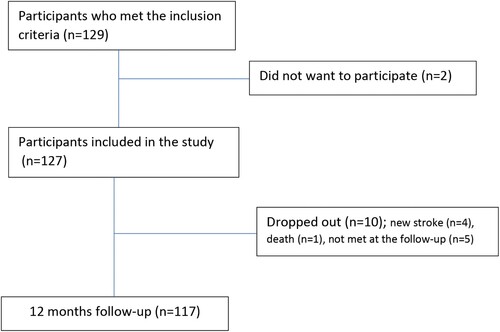
Table 2. Baseline characteristics. Mean ± standard deviation (SD) for continuous data, n (%) for binary data, unless otherwise specified.
Table 3. Cognitive and emotional functioning 12 months after stroke. Mean ± standard deviation (SD) for continuous data, n (%) for categorical data, unless otherwise specified.
Table 4. Predictors of cognitive impairments 12 months after mild stroke.
Table 5. Predictors of emotional impairments 12 months after mild stroke.