
Figures & data
Figure 1. Participant inclusion and exclusion flowchart.
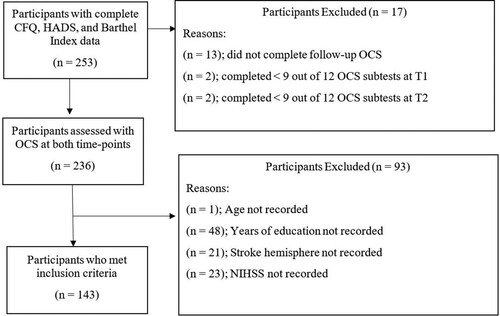
Table 1. Summary of assessments administered at T1 and T2.
Table 2. Clinical and demographic characteristics of included and excluded participants.
Figure 2. Scatterplot illustrating the relationship between awareness and OCI at T2.
Note: The vertical line through the x-axis denotes the cut-off OCI score (39.73) that defines the two groups, whereby OCI scores ≥ 39.73 indicates “moderate-severe cognitive impairment”.
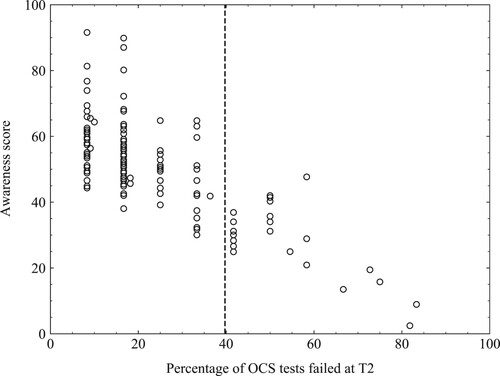
Table 3. Unadjusted and covariate adjusted descriptive statistics for awareness.
Table 4. Hierarchical multiple regression analyses of objective cognitive impairment at T1 as a moderator of the relationship between cognitive change and emotional distress (HADS total score) controlling for the effect of BI and awareness.
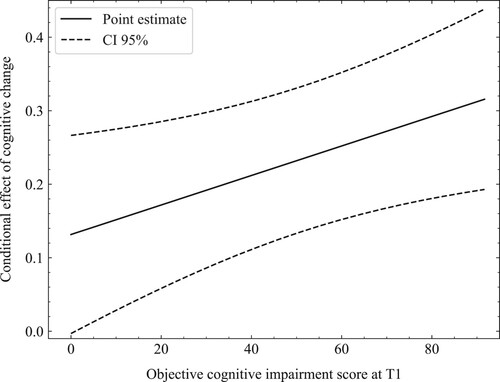
Figure 3. The conditional effect of cognitive change on HADS score as a function of objective cognitive impairment score at T1.
Note: Conditional effect of cognitive change represents the gradient between cognitive change and HADS score for a given OCI score at T1. Those with a higher OCI score at T1 are more sensitive to the effects of cognitive change on HADS. Upper and lower 95% confidence intervals are indicated by the dashed lines.
Supplementary_Information_2.docx
Download MS Word (17.8 KB)Supplementary_Information_1.docx
Download MS Word (21.8 KB)Data availability statement
A minimal dataset that supports the findings of this study is openly available in OSF at https://osf.io/87kjv/10.17605/OSF.IO/87KJV