Figures & data
Table 1. Participant demographic (N = 16).
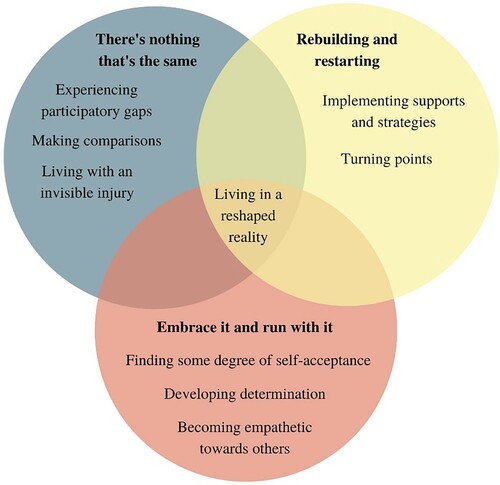
Figure 1. Explanatory model of participants’ experiences of living in a reshaped reality since sustaining their TBI.
A Venn diagram illustrates three coloured circles (blue, yellow, and red) that overlap each other, creating an intersected middle. The three circles represent the three themes, while the intersection represents the overarching theme.