Figures & data
Table 1. Phase I and II participant demographics and baseline features.
Figure 1. Example Goal Assessment Scale (GAS) Worksheet. The GAS allows for individualized goals to be established on a standard scale (−2–2). The above table is an example of four goals (reading, walking, showering, washing dishes) across each of the four goal categories (Brain Health, Body Health, Personal Care, and Housework). The goal attainment levels operationalize the behaviour in order to determine if there is an improvement. The level of change ranges from Much (−2) or Somewhat (−1) Less Than Expected, to Expected (0), to Somewhat (1) or Much (2) Better Than Expected. The goals set in this study were “change goals,” meaning the reported level of baseline behaviour was set at −1.
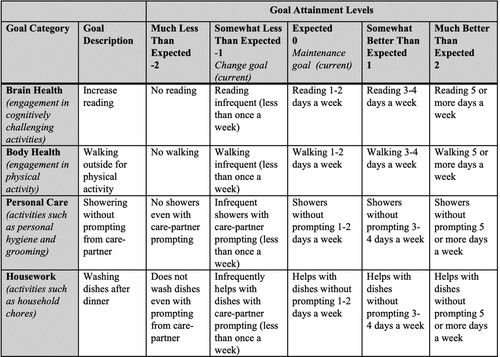
Figure 2. App daily use over study participation depicts average daily use of ActiviDaily during each of the four weeks of study participation. The clinical group (MCI, AD, or bvFTD) data is presented separately.
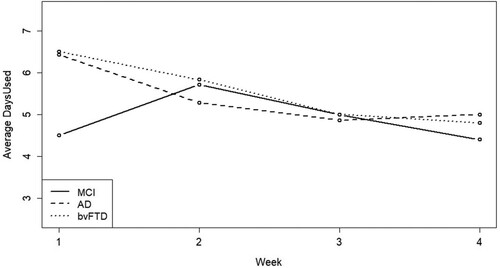
Table 2. App use over study participation.
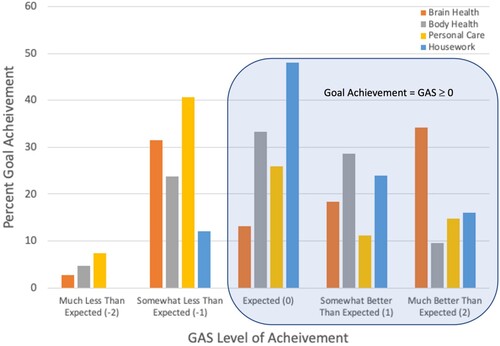
Figure 3. Percent of goal achievement on GAS by activity area illustrates the percent goal achievement for all goals set at each level of the Goal Attainment Scale (GAS). Goals are presented separately for each of the four goal categories (Brain Health, Body Health, Personal Care, and Housework). Achievement of a GAS score of 0, 1 or 2 indicates improvement on the 5 point GAS scale from a baseline behaviour of −1. A score of −1 indicates no change from baseline and −2 indicates a decline in the behaviour.