
Figures & data
Table 1. Demographic characteristics of interviewed participants.
Table 2. Demographic characteristics of patients.
Figure 1. A visual representation of the thematic analysis.
A diagram with a central box titled “Effective Agitation Management and Patient Recovery.” There are two boxes titled “Family” and “Health Care Service” placed above this central box and each are connected to the central box by an arrow. A box titled “Theme 1: Family Contributions to Patient Care” corresponds with the arrow connecting “Family” to “Effective Agitation Management and Patient Recovery.” A box titled “Theme 2: Expectations of the Health Care Service” corresponds with an arrow linking “Family” to “Health Care Service.” A box titled “Theme 3: Supporting Families to Support Patients” corresponds with an arrow linking “Health Care Service” to “Family.”.
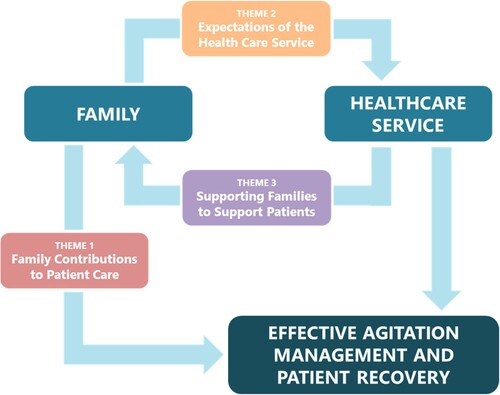
Table 3. Results of thematic analysis.
Supplemental material