
Figures & data
Figure 1. Breakdown of the service users considered but not referred to AppReminders trial.
A flow chart detailing the number of service users considered for participation (285), the number who did not meet inclusion criteria (60), the number who met inclusion criteria but also met an exclusion criteria (75), the number who met the study criteria but were not referred for a different reason (87) and the number who were referred to the study (63).
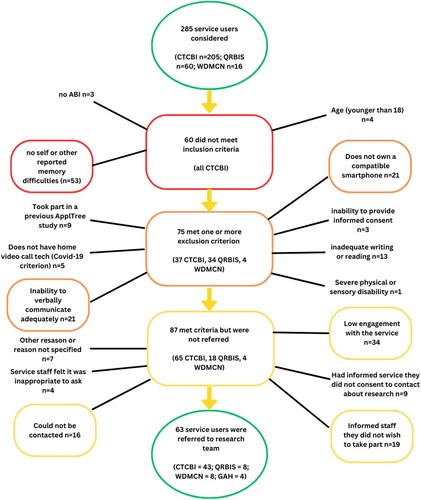
Figure 2. The trial flowchart with enrolment, recruitment, retention and adherence for the 63 referrals to the AppReminders trial.
A flow chart describing the number of participants referred (63), the number enrolled (39), the number randomized following 3 week baseline (29), the number who recieved the app (21) and the number who completed follow-up (19).
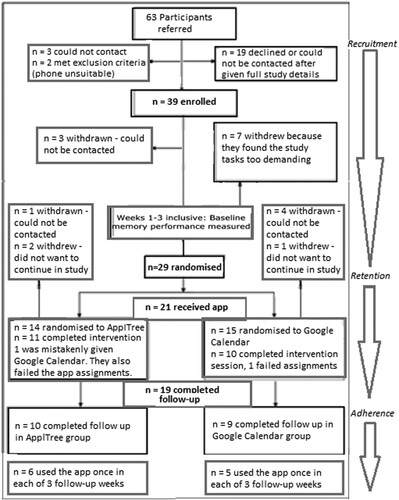
Table 1. Baseline characteristics for the randomized participants.
Table 2. Change in memory performance for participants who completed the study in both ApplTree and Google Calendar randomized groups.
Table 3. Differences in UTAUT domain scores between ApplTree and Google Calendar groups.
Figure 3. Themes and sub-themes that arose from participants’ feedback after they were given ApplTree or Google Calendar apps.
Overview of themes from the qualitative analysis. Feedback was split into “Usability” and “Usefulness” themes. Sub-themes of “Usability” were “Comments about feeling competent” “Facilitators” (with sub-themes “app design,” “perceived need,” “tutorial and practice,” “help from others”) and “Barriers” (with sub-themes “hardware issues,” “app issues,” “lack of help from others,” “lack of perceived ability with technology” and “memory and cognitive challenges”). “Usefulness” sub-themes include “Use cases,” “Facilitators” (with sub-themes “improvement on Previous memory strategies,” “useful app features,” “suggested features to improve usefulness”), and “Barriers” (with sub-themes “hardware issues,” “app issues,” “already use well established strategies” and “not much to be reminded about”).
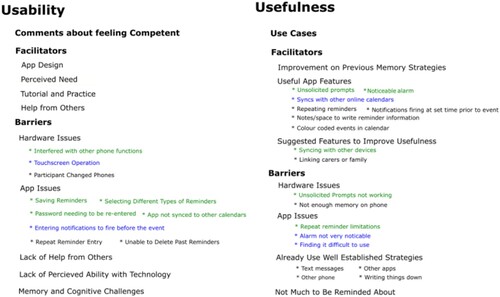
Table 4. RBMT verbal memory, prospective memory and orientation plus TEA elevator counting.
Supplemental material