
Figures & data
Table 1. Participant demographic characteristics.
Table 2. Treatment structure and modules.
Figure 1. Thematic map displaying participants’ experiences of the intervention.
Four distinct squares representing each qualitative theme displayed horizontally. There are three to four circles included within each square which represent the subthemes. Underneath the squares is an arrow representing the treatment journey across time.
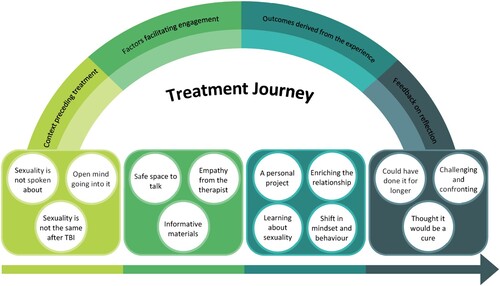
Table 1. Semi-structured interview schedule.