
Figures & data
Figure 1. Reproduced from Elward and Vargha-Khadem (Citation2018). Data from two studies designed to investigate semantic learning in DA. Recall Learning (top panel): Participants complete six recall tests during learning. The cued recall test (highlighted with a box) indicates that participants did not show good learning with this method. Recognition Learning (bottom panel): Participants complete recognition tests during learning. In this case, performance on the cued recall test (highlighted with a box) was similar to controls.
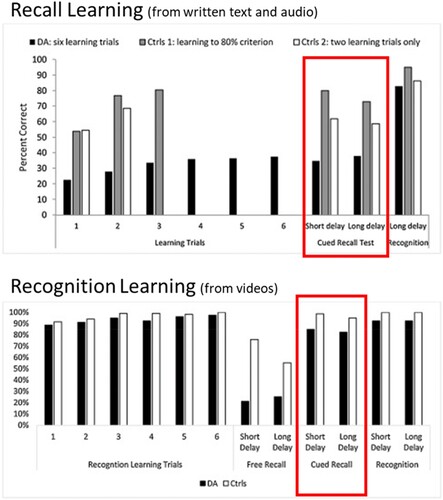
Table 1. Neuropsychological assessment results of patient H.
Figure 2. Manual segmentation of the hippocampus. Top: 3T-MRI scan of a 14-year-old male control participant (left) alongside Patient H (right) showing the reduced volume of the subicular complex (in green) and CA-DG region in (orange). Bottom. ICV-corrected hippocampal volumes for Patient H compared with 32 healthy controls (8y – 38y; 16male) indicating a 34% volume atrophy of the hippocampus.
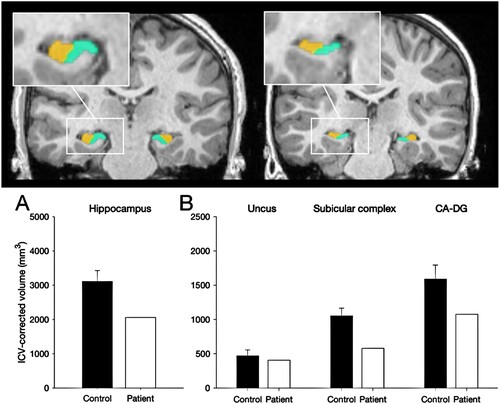
Table 2. Crawford’s Bayesian test for single case assessment (Crawford & Garthwaite, Citation2007) to identify significant differences between patient to the controls on IQ and CMS test scores.
Table 3. Overview of the test procedures over three weeks.
Figure 3. Schematic of the protocols.
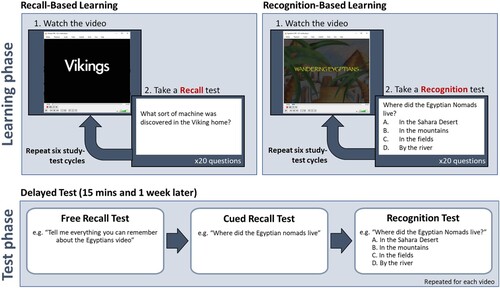
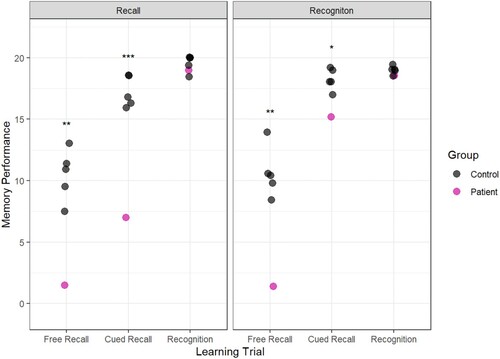
Figure 4. Mean memory performance across the two learning conditions. Error bars indicate 1+/- the standard error of the mean. The outcomes of the case-control statistical tests are indicated with symbols, *p < 0.05, **p < 0.01, ***p < 0.001.
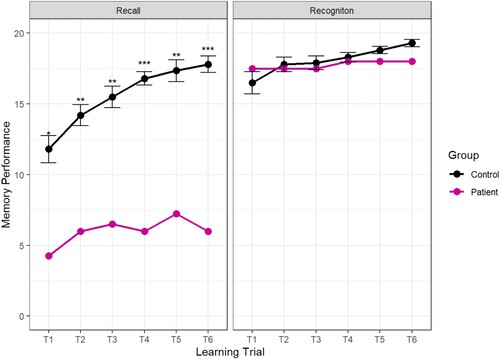
Figure 5. Memory performance in the 15-Minute Delayed Test following recall learning (left panel) and recognition learning (right panel). The outcomes of the case-control statistical tests are indicated with symbols, *p < 0.05, **p < 0.01, ***p < 0.001.
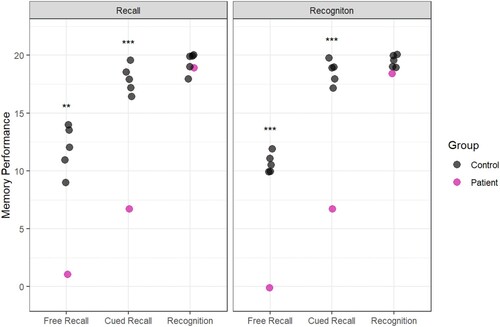
Figure 6. Memory performance in the 1-week Delayed Test. The outcomes of the case-control statistical tests are indicated with symbols, *p < 0.05, **p < 0.01, ***p < 0.001.
NSL_Paper_SupplementaryMaterials.docx
Download MS Word (22.1 KB)Data availability
Data and analysis code are available on the Open Science Framework. https://doi.org/10.17605/OSF.IO/KS3MQ.