
Figures & data
Table 1. Structure of the treatment protocol.
Figure 1. Recruitment and flow of participants throughout the study. Notes: *An attempt was made to balance the range of aphasia severity among participants concurrently receiving intervention to ensure a manageable caseload for the clinician.
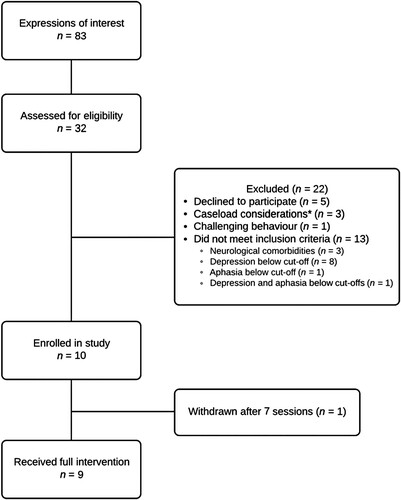
Table 2. Participant demographic and baseline characteristics.
Table 3. Participant outcome summary: interpretation of results.
Figure 2. Participant AA’s self-reported depression levels (DISCs) and observer-rated symptoms of depression (SADQ) and anxiety (BOA) across baseline, intervention, and follow-up phases. DISCs: Depression Intensity Scale Circles; SADQ: Stroke Aphasic Depression Questionnaire; BOA: Behavioural Outcomes of Anxiety. Notes: Higher scores denote worse depressive/anxiety symptoms. Dotted lines demarcate the different phases; grey shadings indicate treatment sessions; trend lines calculated using ordinary least squares estimation are superimposed on the raw data.
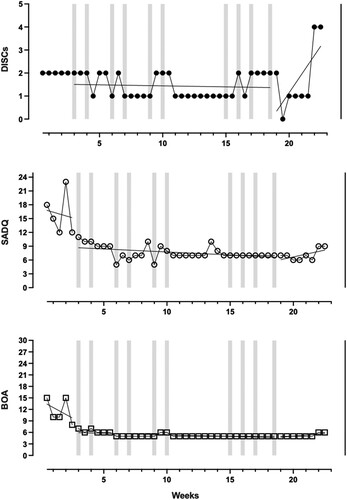
Table 4. Tau-U analyses for subjective depressive symptoms, and depressive and anxiety symptoms as observed by close other.
Figure 3. Participant BB’s self-reported depression levels (DISCs) and observer-rated symptoms of depression (SADQ) and anxiety (BOA) across baseline, intervention, and follow-up phases. DISCs: Depression Intensity Scale Circles; SADQ: Stroke Aphasic Depression Questionnaire; BOA: Behavioural Outcomes of Anxiety. Notes: Higher scores denote worse depressive/anxiety symptoms. Dotted lines demarcate the different phases; grey shadings indicate treatment sessions; trend lines calculated using ordinary least squares estimation are superimposed on the raw data.
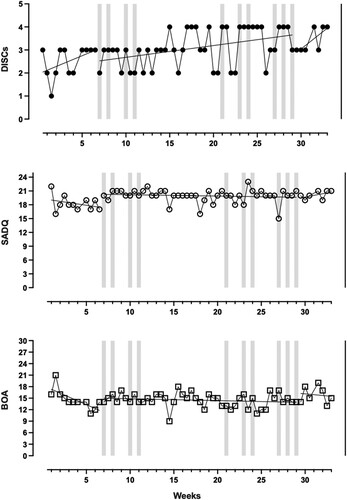
Figure 4. Participant CC’s self-reported depression levels (DISCs) and observer-rated symptoms of depression (SADQ) and anxiety (BOA) across baseline, intervention, and follow-up phases. DISCs: Depression Intensity Scale Circles; SADQ: Stroke Aphasic Depression Questionnaire; BOA: Behavioural Outcomes of Anxiety. Notes: Higher scores denote worse depressive/anxiety symptoms. Dotted lines demarcate the different phases; grey shadings indicate treatment sessions; trend lines calculated using ordinary least squares estimation are superimposed on the raw data.
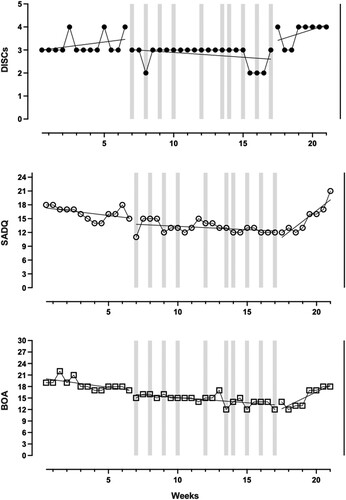
Figure 5. Participant DD’s self-reported depression levels (DISCs) and observer-rated symptoms of depression (SADQ) and anxiety (BOA) across baseline, intervention, and follow-up phases. DISCs: Depression Intensity Scale Circles; SADQ: Stroke Aphasic Depression Questionnaire; BOA: Behavioural Outcomes of Anxiety. Notes: Higher scores denote worse depressive/anxiety symptoms. Dotted lines demarcate the different phases; grey shadings indicate treatment sessions; trend lines calculated using ordinary least squares estimation are superimposed on the raw data.
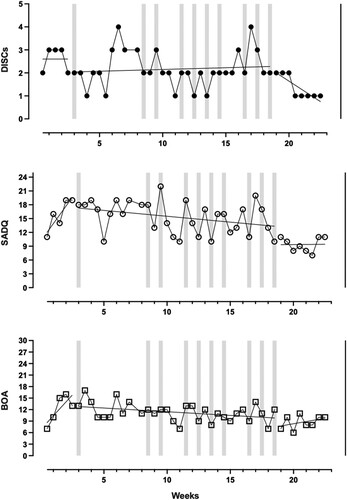
Figure 6. Participant EE’s self-reported depression levels (DISCs) and observer-rated symptoms of depression (SADQ) and anxiety (BOA) across baseline, intervention, and follow-up phases. DISCs: Depression Intensity Scale Circles; SADQ: Stroke Aphasic Depression Questionnaire; BOA: Behavioural Outcomes of Anxiety. Notes: Higher scores denote worse depressive/anxiety symptoms. Dotted lines demarcate the different phases; grey shadings indicate treatment sessions; trend lines calculated using ordinary least squares estimation are superimposed on the raw data.
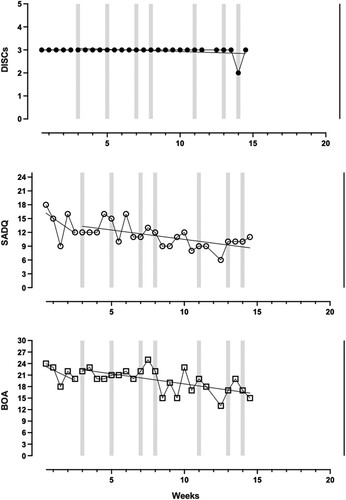
Figure 7. Participant FF’s self-reported depression levels (DISCs) and observer-rated symptoms of depression (SADQ) and anxiety (BOA) across baseline, intervention, and follow-up phases. DISCs: Depression Intensity Scale Circles; SADQ: Stroke Aphasic Depression Questionnaire; BOA: Behavioural Outcomes of Anxiety. Notes: Higher scores denote worse depressive/anxiety symptoms. Dotted lines demarcate the different phases; grey shadings indicate treatment sessions; trend lines calculated using ordinary least squares estimation are superimposed on the raw data.
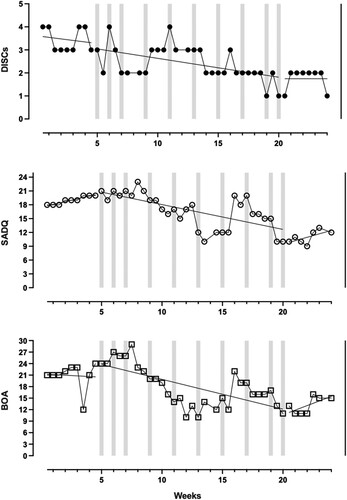
Figure 8. Participant GG’s self-reported depression levels (DISCs) and observer-rated symptoms of depression (SADQ) and anxiety (BOA) across baseline, intervention, and follow-up phases. DISCs: Depression Intensity Scale Circles; SADQ: Stroke Aphasic Depression Questionnaire; BOA: Behavioural Outcomes of Anxiety. Notes: Higher scores denote worse depressive/anxiety symptoms. Dotted lines demarcate the different phases; grey shadings indicate treatment sessions; trend lines calculated using ordinary least squares estimation are superimposed on the raw data.
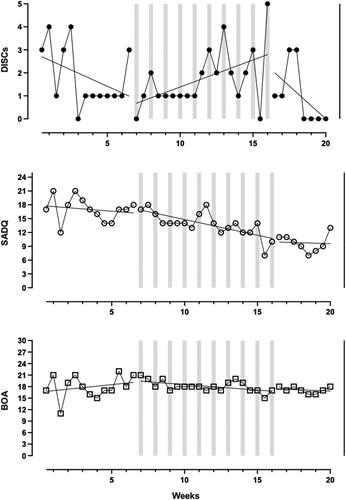
Figure 9. Participant HH’s self-reported depression levels (DISCs) and observer-rated symptoms of depression (SADQ) and anxiety (BOA) across baseline, intervention, and follow-up phases. DISCs: Depression Intensity Scale Circles; SADQ: Stroke Aphasic Depression Questionnaire; BOA: Behavioural Outcomes of Anxiety. Notes: Higher scores denote worse depressive/anxiety symptoms. Dotted lines demarcate the different phases; grey shadings indicate treatment sessions; trend lines calculated using ordinary least squares estimation are superimposed on the raw data.
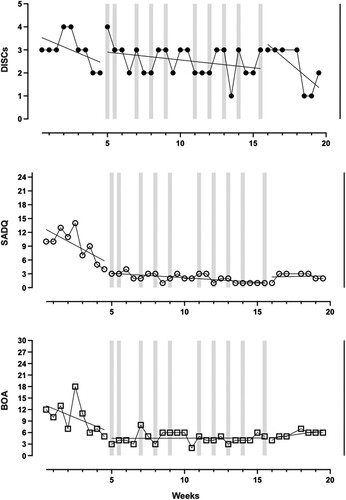
Figure 10. Participant II’s self-reported depression levels (DISCs) and observer-rated symptoms of depression (SADQ) and anxiety (BOA) across baseline, intervention, and follow-up phases. DISCs: Depression Intensity Scale Circles; SADQ: Stroke Aphasic Depression Questionnaire; BOA: Behavioural Outcomes of Anxiety. Notes: Higher scores denote worse depressive/anxiety symptoms. Dotted lines demarcate the different phases; grey shadings indicate treatment sessions; trend lines calculated using ordinary least squares estimation are superimposed on the raw data.
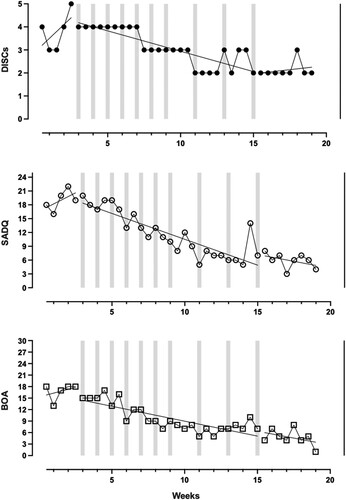
Figure 11. Participant JJ’s self-reported depression levels (DISCs) and observer-rated symptoms of depression (SADQ) and anxiety (BOA) across baseline, intervention, and follow-up phases. DISCs: Depression Intensity Scale Circles; SADQ: Stroke Aphasic Depression Questionnaire; BOA: Behavioural Outcomes of Anxiety. Notes: Higher scores denote worse depressive/anxiety symptoms. Dotted lines demarcate the different phases; grey shadings indicate treatment sessions; trend lines calculated using ordinary least squares estimation are superimposed on the raw data.
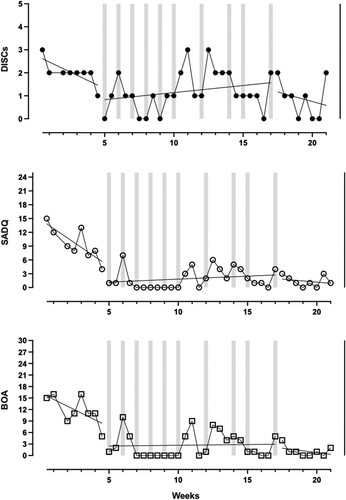
Table 5. Intervention elements and supported conversation techniques: frequency analysis.