
Figures & data
Table 1. Summary of sample characteristics for all participants (healthy controls n = 50, stroke n = 48).
Table 2. Descriptive statistics and ANCOVA comparisons between sample groups on MET-Home and OxMET as well as additional covariates.
Table 3. Spearman’s Rho correlations between OxMET and MET-Home performance metrics inclusive of healthy controls and stroke survivors.
Table 4. Summary of attempt and completion of the OxMET and MET-Home.
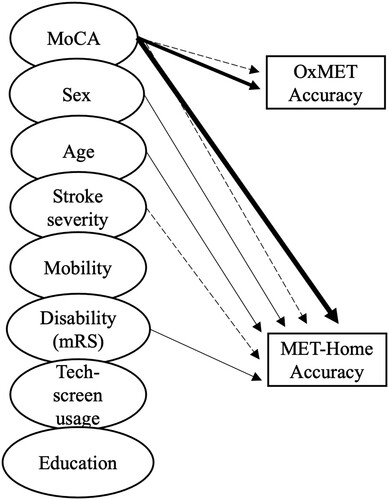
Figure 1. Visualization of statistically significant predictive associations across all participants (solid lines) and only stroke survivors (dashed lines) for task accuracy. Thicker lines are associations which survived corrections for multiple comparison (p < .006). Figure available under CC-BY 4.0 attribution license (https://osf.io/xw3s8).
Supplemental materials_revision1.docx
Download MS Word (33.6 KB)Data availability statement
The data that support the findings of this study are openly available in Open Science Framework at https://doi.org/10.17605/OSF.IO/PZWGF
.