
Figures & data
Table 1. T4-ample descriptives.
Figure 1. Calculation of the reliable clinical change index.
Note: Standard error (SE) is calculated by using SD and coefficient alpha from the normative sample.
Calculation of the Reliable Clinical Change Index equation with pre- and post-test values.
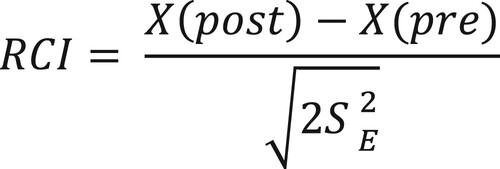
Table 2. Comparison of non-responders and the T4 sample.
Figure 2. PedsQL-MFS (parent-report) Total scale and subscales throughout T1–T4 for the T4 sample.
Graphical illustrations of the PedsQL-MFS parent-report for pGMT and pBHW separately. Lines represent mean scores for Total fatigue, General fatigue, Sleep/rest, and Cognitive fatigue throughout T1–T4.
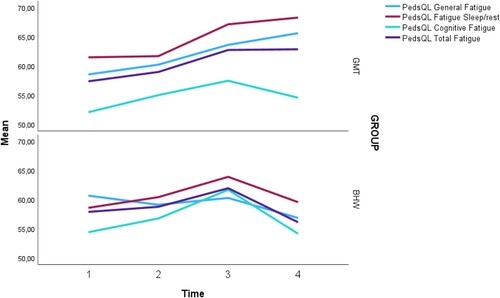
Table 3. Two-year outcome for T4 sample on the PedsQL-MFS parent-report.
Table 4. RCIs for the PedsQL-MFS total score.
Data availability statement
The data presented in this study are not publicly available due to protection of privacy.