
Figures & data
Figure 1. Design of the Brainfit study.
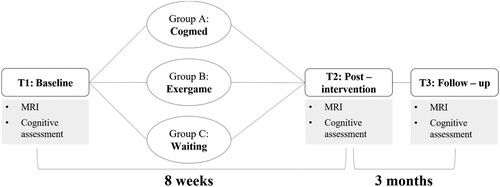
Table 1. Demographics, medical characteristics, and training data at baseline (T1).
Figure 2. Short- and long-term effects depicted as a series of boxplots (with interquartile range and minimum and maximum value) in (a) CBF within the working memory ROI and (b) structural connectivity (number of tracts [k]) presented for the three groups. The lines connect the mean values. Depending on comparison (T1–T2, T1–T3), sample sizes for cerebral blood flow analyses differed. Waiting control group: n = 8 to 10; Cogmed group: n = 7 to 9; Exergame group: n = 7 to 10; see Table S2. Depending on comparison (T1–T2, T1–T3), sample sizes for structural connectivity analyses differed. Waiting control group: n = 10 to 13; Cogmed group: n = 8 to 10; Exergame group: n = 7 to 10; see Table S3. *p < 0.05.
![Figure 2. Short- and long-term effects depicted as a series of boxplots (with interquartile range and minimum and maximum value) in (a) CBF within the working memory ROI and (b) structural connectivity (number of tracts [k]) presented for the three groups. The lines connect the mean values. Depending on comparison (T1–T2, T1–T3), sample sizes for cerebral blood flow analyses differed. Waiting control group: n = 8 to 10; Cogmed group: n = 7 to 9; Exergame group: n = 7 to 10; see Table S2. Depending on comparison (T1–T2, T1–T3), sample sizes for structural connectivity analyses differed. Waiting control group: n = 10 to 13; Cogmed group: n = 8 to 10; Exergame group: n = 7 to 10; see Table S3. *p < 0.05.](/cms/asset/0a8d0944-d46f-4865-b0c7-d65be7b0640e/pnrh_a_2356294_f0002_ob.jpg)
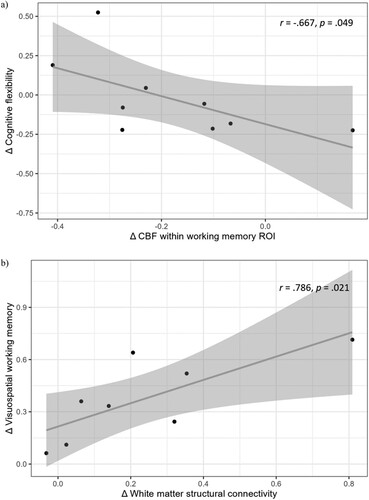
Figure 3. (a) Correlation between short-term changes in CBF within the working memory ROI and short-term changes in cognitive flexibility (n = 9) and (b) Correlation between long-term changes in structural connectivity and long-term changes in visuospatial working memory (n = 8). The solid line represents the linear regression fit. The shaded area around the line indicates the 95% confidence interval.
Schuerch_Supplement_NeuropsychRehab_updated.docx
Download MS Word (77.6 KB)Data availability statement
The data that support the findings of this study are available from the corresponding author, [RE], upon reasonable request.