2,348
Views
3
CrossRef citations to date
0
Altmetric
Research Article

Spatial and temporal variations of PM2.5 concentrations in Chinese cities during 2015-2019

ORCID Icon, &
Pages 2695-2707 | Received 04 May 2021, Accepted 25 Sep 2021, Published online: 13 Oct 2021

Figures & data

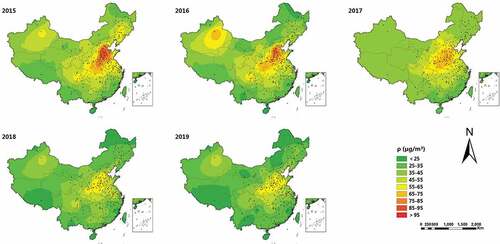
Figure 1. Spatial distribution maps of PM2.5 concentrations in China during 2015–2019.

Figure 1. Spatial distribution maps of PM2.5 concentrations in China during 2015–2019.

Table 1. Global spatial autocorrelation of PM2.5 in China, 2015–2019.

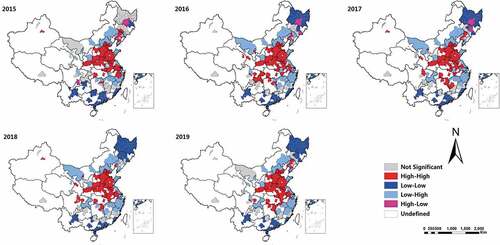
Figure 2. Local spatial autocorrelation cluster maps of PM2.5 in China, 2015 to 2019.

Figure 2. Local spatial autocorrelation cluster maps of PM2.5 in China, 2015 to 2019.

Table 2. Results for yearly spatial clusters of PM2.5 in China from 2015 to 2019.

Figure 3. The spatial and spatiotemporal clusters of PM2.5 in China, 2015–2019. (a) The spatial clusters of PM2.5. (b) The spatiotemporal clusters of PM2.5.
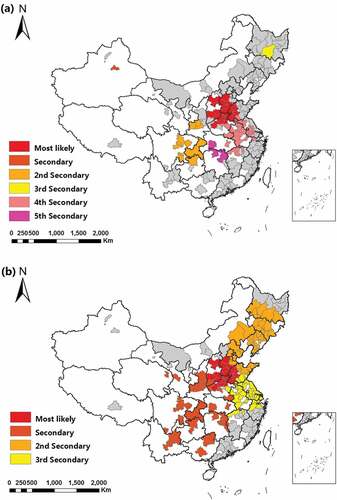
Figure 3. The spatial and spatiotemporal clusters of PM2.5 in China, 2015–2019. (a) The spatial clusters of PM2.5. (b) The spatiotemporal clusters of PM2.5.

Table 3. Results for spatiotemporal clusters of PM2.5 in China from 2015 to 2019.

Supplemental material

Supplemental Material

Download MS Word (539 KB)