Figures & data
Table 1. Descriptive data of the participants.
Table 2. The difference in oxylipin and 8-iso-PGF2α concentration between cases and referents in symptom rooms (SR) and control rooms (CR). The oxylipins were grouped into four groups depending on their biosynthetic pathway. Z-values according to Wilcoxon signed-rank test.
Figure 1. Mean (±Standard error, SE) reported intensity of mucosal, skin and general symptoms in symptom rooms (SR) and control rooms (CR).
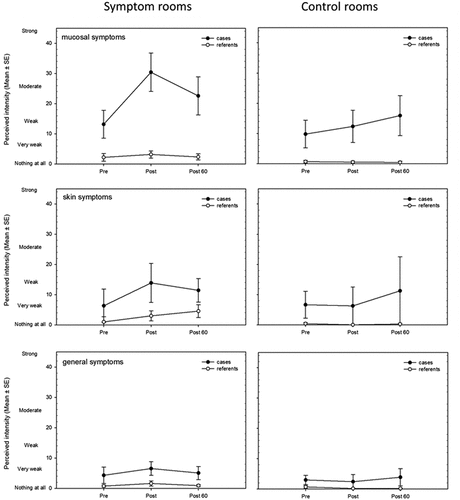
Figure 2. The median differences in oxylipin concentration (grouped into four groups depending on the biosynthetic pathway) and concentration of 8-iso-PGF2α between case-referent in the SR (symptom rooms) and the CR (control rooms).
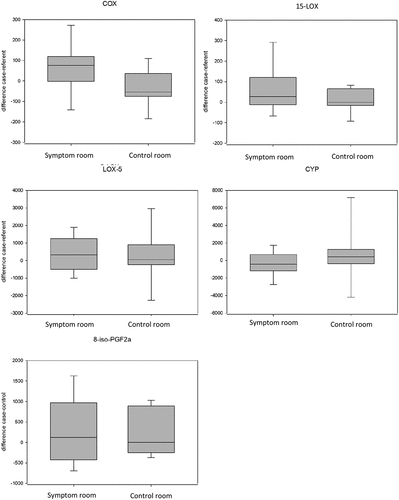
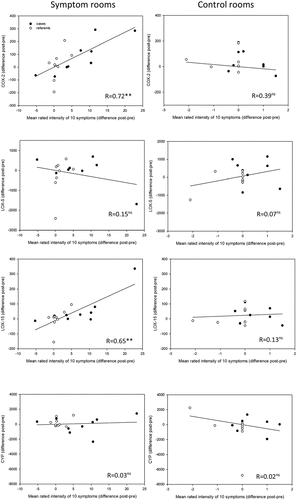
Figure 3. Spearman’s correlation between the mean reported intensity of symptoms and oxylipin concentration. The oxylipins were grouped into four groups depending on their biosynthetic pathway (a) COX, (b) 5-LOX-5, (c) 15-LOX, (d) CYP.