
Figures & data
Table 1. Sensitivity, specificity, PPV, and NPV for different single-item self-report measure (SIDU) threshold scores for sample A and B.
Figure 1. Relationships between objective degree of urbanisation measures (left panels: surrounding address density, SAD; right panels: urbanisation grade categories) and the single-item self-report measure (SIDU), for two independent panels (A: N = 36, 65+, and B: N = 121, 55+). Correlation coefficients (r or rs) and p-values are shown for each evaluated relationship. Dots on the right side of each red dashed red line represent those living in extremely urbanised (5) areas. SIDU scores are jittered to optimize visualization. *This coefficient reflects the relationship between and the SIDU.
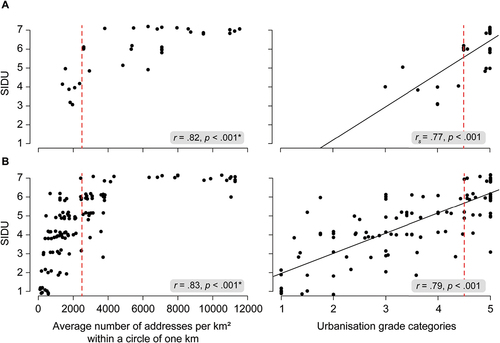
Table 2. Relationships between the single-item self-report measure (SIDU) and both the surrounding address density (SAD) and urbanisation grade categories, in Sample B.