Figures & data
Figure 1. The effects of 4.9 GHz RF on spatial memory and emotional behaviours in mice. (a) The experimental procedure. (b) Body weight of mice during exposure. (c) Representative activity track in OFT. The red and blue dots in open field indicate the beginning and ending points, respectively. (d) Total distance travelled in OFT. (e) Time spent in central area. (f) Number of central entries. (g) Representative activity track in Y-maze. The red and blue dots in Y-maze indicate the beginning and ending points, respectively. (h) Percentage of time in novel arm. (i) Number of novel arm entries. (j) The movement status of mice in TST. (k) Immobility time in TST. n = 12 for each group. All data are presented as mean ± SEM. *P <0.05.
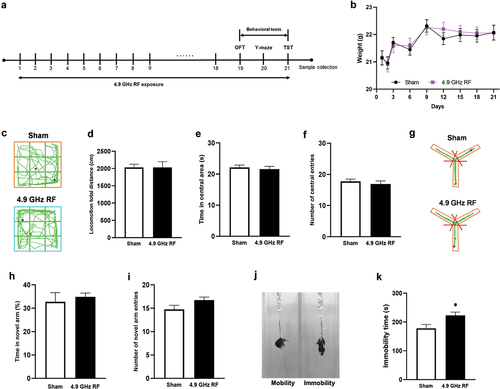
Figure 2. The level of brain injury after exposure of 4.9 GHz RF. (a) The level of NSE concentration in serum. (b) The level of S100B concentration in serum. n = 10 for each group. (c) Representative images of HE staining in hippocampus (Hippo) and amygdala (AM). (d) Representative images of Nissl staining in Hippo and AM. Scale bar = 100 μm for Hippo; scale bar = 50 μm for CA1 and DG regions; scale bar = 200 μm for AM. (e) The number of neurons in CA1. (f) The number of neurons in DG. (g) The number of neurons in amygdala. All data are presented as mean ± SEM. *P <0.05, **P <0.01.
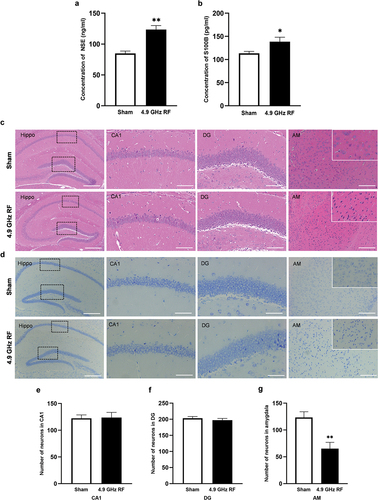
Figure 3. The effects of 4.9 GHz RF on the levels of cell apoptosis in hippocampus (Hippo) and amygdala (AM). (a) Representative images of TUNEL staining in hippocampus. Scale bar = 100 μm for Hippo, scale bar = 50 μm for CA1 and DG regions. (b) Representative images of TUNEL staining in amygdala. Scale bar = 100 μm. (c) The apoptosis rate in hippocampal CA1 region. (d) The apoptosis rate in hippocampal DG region. (e) The apoptosis rate in amygdala. All data are presented as mean ± SEM.
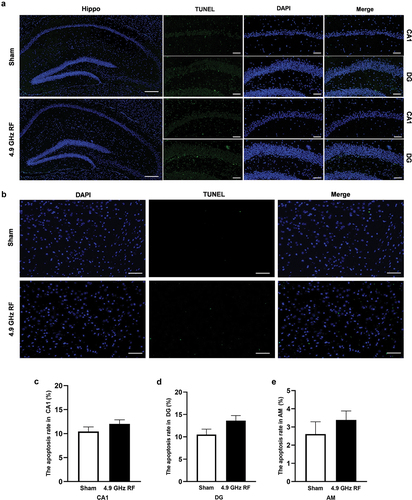
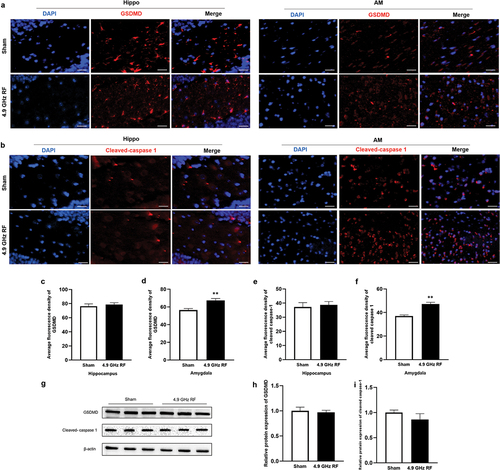
Figure 4. The effects of exposure to 4.9 GHz RF on pyroptosis in hippocampus (Hippo) and amygdala (AM). (a) Representative images of immunofluorescence staining of GSDMD in Hippo and AM. (b) Representative images of immunofluorescence staining of Cleaved caspase-1 in Hippo and AM. Scale bar = 50 μm for Hippo, scale bar = 100 μm for AM. (c, e) Average fluorescence density of GSDMD and Cleaved caspase-1 in hippocampus. (d, f) Average fluorescence density of GSDMD and Cleaved caspase-1 in amygdala. n = 3 for each group. (g) Representative western blot results of GSDMD and Cleaved caspase 1 in hippocampus. n = 3 for each group. (h) Relative protein level of GSDMD. (i) Relative protein level of Cleaved caspase-1. All data are presented as mean ± SEM. **P <0.01.