Figures & data
Table 1. Life cycle inventory for each washing scenario.
Figure 1. Lightness difference, ΔLs*, of the tested standard soiled textile washed at 40°C and 60°C with ECE reference detergent (N=20) according to the studied washing scenarios. A statistically significant difference (p < 0.05 for Duncan test following different letters above column for each soil).
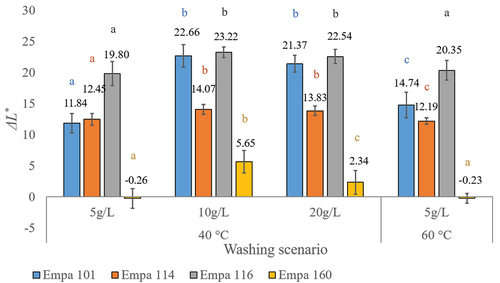
Figure 2. E. coli, P. aeruginosa and S. aureus as log CFU/carrier and logarithmic reduction (numbers above columns) on cotton carriers (N=15) after washing regimes combing ECE reference detergent and temperature (ND – not detected). A statistically significant difference (p < 0.05 for Duncan test following different letters above column for each bacterial strain).
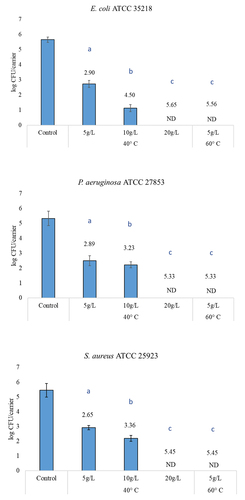
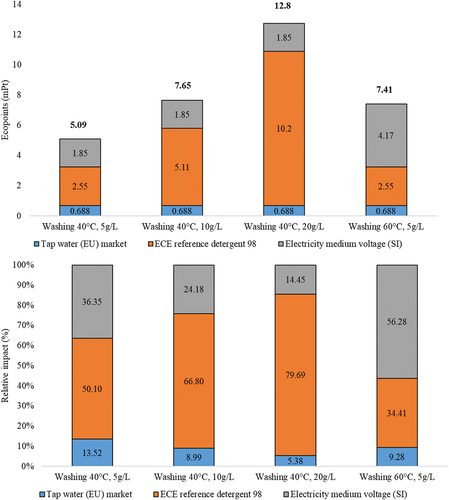
Figure 3. Results of life cycle assessment as eco points (mPt) and relative impact (%) of different washing cycles combining ECE reference detergent and temperature of washing.