Figures & data
Figure 1. Locations of veteran communities.
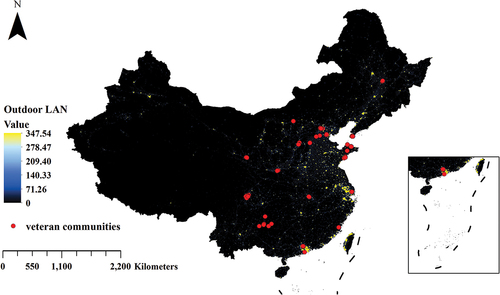
Table 1. Demographic characteristics of depressive symptoms cases and controls.
Table 2. A summary of participants’ exposure to outdoor LAN (nW/cm2/sr) during the 1 year before the investigation.
Figure 2. The ORs and 95%CIs of depressive symptoms for stratified analyses associated with per IQR increase in outdoor LAN exposure during the 1 year before the investigation.
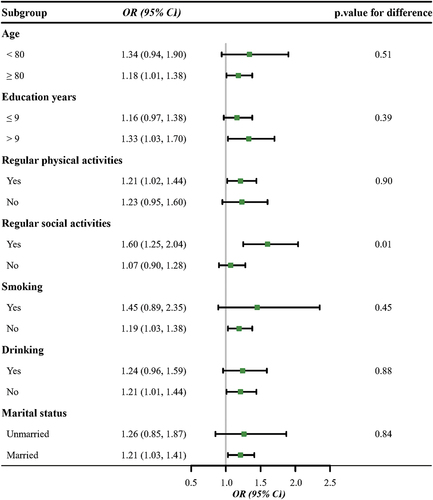
Table 3. The ORs and 95%CIs of depressive symptoms associated with exposure to outdoor LAN during the 1 year before the investigation in crude and adjusted models.
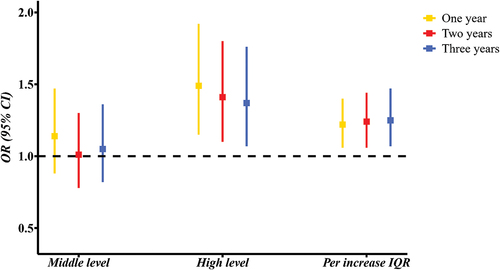
Figure 3. The ORs and 95%CIs of depressive symptoms at different levels of LAN exposure against the lowest level and those associated with per IQR (53.42 nW/cm2/sr) increase in LAN during different exposure periods.