
Figures & data
Figure 1. Schematic representation of a c-ring test piece with orientation reference (image adapted from Brooking et al. [Citation7]).
![Figure 1. Schematic representation of a c-ring test piece with orientation reference (image adapted from Brooking et al. [Citation7]).](/cms/asset/98b83d98-821a-4b18-a571-cff68b2f6471/ymht_a_2182587_f0001_c.jpg)
Table 1. Alloy composition in wt % (nominal) [Citation9].
Figure 2. (a) SEM image showing parallel cracks (bright lines) emanating from salt-ring features on the surface of a CMSX-4 c-ring test piece, (b) low-z beam sensitive amorphous material in porous nickel oxide and (c) cracks in substrate beneath a cross sectioned salt ring, with EDS line-scan inset showing enhanced O, Cl and Al concentrations in a crack (2 hours testing at 550°C).
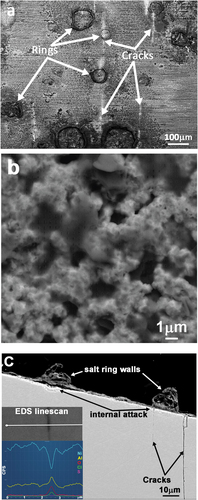
Figure 3. (a) HAADF-STEM image showing a primary crack, several crack embryos and a voluminous surface corrosion product, and (b) EDS maps of a γʹ precipitate, including surface corrosion and crack embryos.
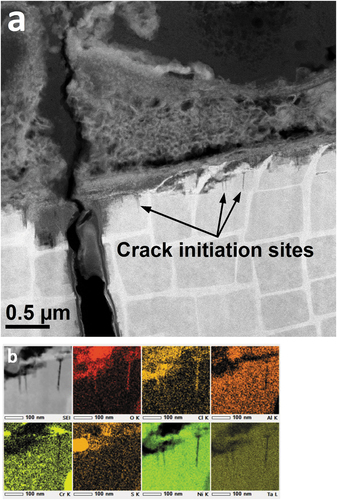
Figure 4. (a) BF-STEM image showing a primary crack tip in a 10-minute exposure CMSX-4 c-ring and (b) the accompanying EDS maps revealing element distributions at the crack tip.
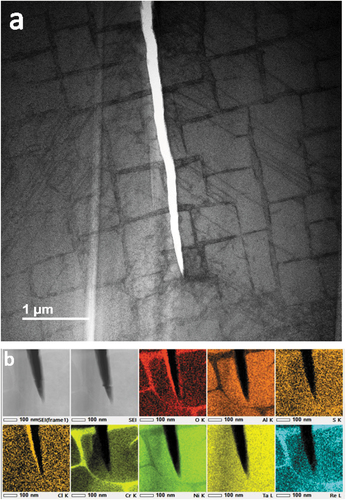
Figure 5. (a) HAADF-STEM image of corrosion products in the vicinity of a salt ring feature. (b–d) EDS maps showing outward growth of porous and dense NiO layers above a chromium rich oxide/sulphate formed on the alloy surface and Cl-O attack of the γ matrix network and (e) HAADF STEM image showing oxidised γ matrix (2-hour test specimen).
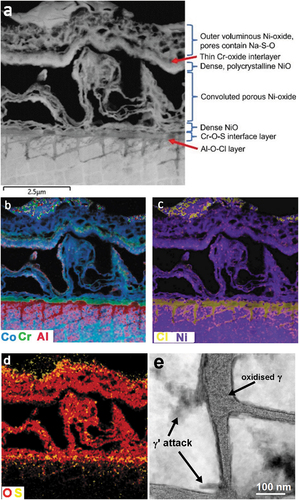
Figure 6. (a) HAADF STEM image ( EDS locations indicated), EDS composite maps (b) & (c) showing the complex nature of the corrosion products in a prior salt ring wall and the preferential attack of γʹ. (2-hour exposure).
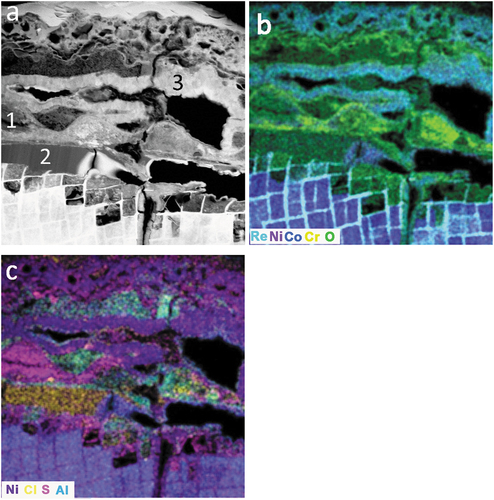
Table 2. Scale chemistry, atomic % (others = Al, Ti, Cr, Mo, Hf, Ta, W and Re).
Figure 7. (a) BF-STEM image revealing a crack and the associated features and (b) the distribution of oxidising species and their relative locations.
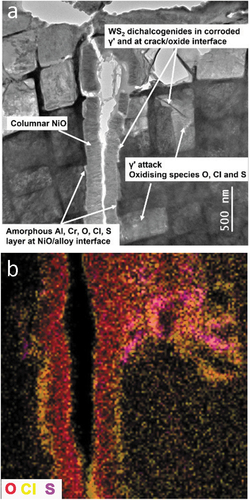
Figure 8. (a) BF-STEM image features common to primary and secondary cracks, (b) expanded BF-STEM view of a, and (c), BF-TEM image showing orthogonal arrays of MS2 films in a corroded γʹ precipitate (a & b 10 minute test and c, 2 hour exposure).
Figure 9. HAADF STEM image revealing the atomic structure of a dichalcogenide strand, with UVW [110] R3m:H model structure overlayed (COD 9012102).
![Figure 9. HAADF STEM image revealing the atomic structure of a dichalcogenide strand, with UVW [110] R3m:H model structure overlayed (COD 9012102).](/cms/asset/8b1b9d16-477c-4759-a9f2-ea3ea41047c1/ymht_a_2182587_f0009_c.jpg)