
Figures & data
Figure 1. Principles of a power conversion system [Citation3].
![Figure 1. Principles of a power conversion system [Citation3].](/cms/asset/d8712404-7b24-48b8-91bc-f23a142614ec/ymht_a_2205744_f0001_c.jpg)
Figure 2. Various power conversion efficiencies [Citation3].
![Figure 2. Various power conversion efficiencies [Citation3].](/cms/asset/5ebaa927-9f75-4464-a9bc-f794dfa9c87f/ymht_a_2205744_f0002_c.jpg)
Table 1. Composition based on EDX outputs (wt.%) [Citation17].
Figure 3. Simple schematic of a furnace [Citation18].
![Figure 3. Simple schematic of a furnace [Citation18].](/cms/asset/afb7149a-6487-40fb-b88c-8093a4e95005/ymht_a_2205744_f0003_c.jpg)
Figure 4. Averaged weight change plot showing mass change vs exposure time for test 1 and 2; (a) Metal change for 800 °C/1 bar/CO2 + 2.7 mol% H2O + 0.17 mol% O2 and (b) Metal change for (b) 800 °C/1 bar/CO2 + 1.43 mol% N2 + 0.17 mol% O2 + 300 ppm SO2.
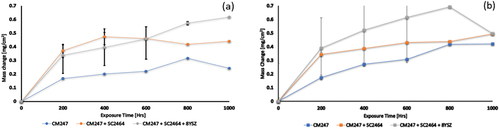
Figure 5. Dimensional metrology for tests (a) 1 and (b) 2.
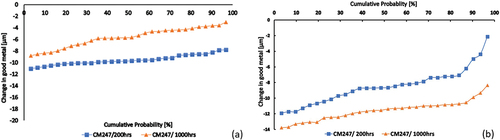
Table 2. Kp values where the exposure time was 1000 h. (Units are mg2/cm−4.s−1).
Figure 6. SEM micrographs of CM247. (1), (2) and (3) represent the unexposed samples of CM247, CM247+SC2464, and CM247+SC2464+8YSZ. respectively. (a) and (b) CM247 at 1000 h for test 1 and 2. respectively, (c) and (d) CM247+SC2464 at 1000h for test 1 and 2. respectively. whilst (e) and (f) CM247+SC2464+8YSZ at 1000h for test 1 and 2. respectively.
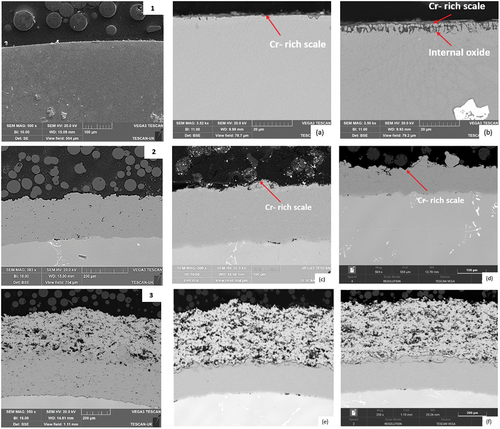
Figure 7. Backscattered and EDX maps for test 1 exposed for 1000 h. (a) CM247, (b) CM247 + SC2464, and (c) CM247 + SC2464 + 8YSZ.
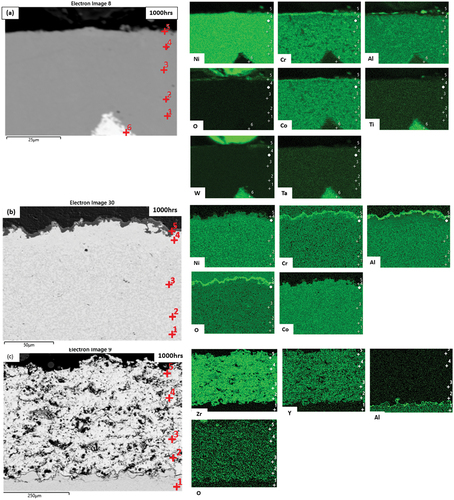
Figure 8. Backscattered and EDX maps for test 2 exposed for 1000 h (a) CM247, (b) CM247 + SC2464 and (c) CM247 + SC2464 + 8YSZ.
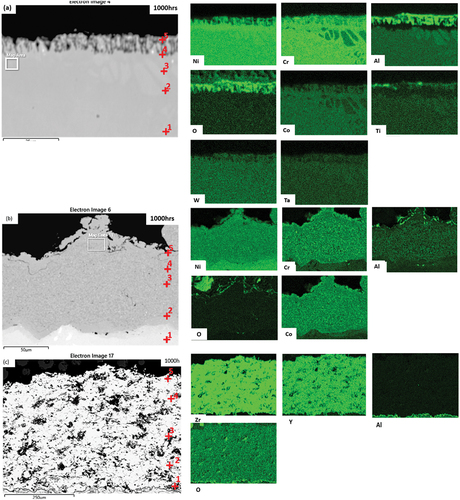
Table 3. EDX analysis composition (wt.%) of CM247 exposed for 1000 h in test environment 1 (C excluded from analysis).
Table 4. Elemental composition of CM247 in test environment 2 (wt.%).