Figures & data
Figure 1. Schematic of the DENSsolutions in situ chip. (a) The DENSsolutions in situ chip (P.J.GH.SS.2, climate chip for JEOL holder). It can be used for correlative imaging in gas environments across the I14 beamline and the ePSIC E01 TEM, or for liquid experiments on the I14 beamline. The silicon nitride imaging windows are indicated in yellow. A liquid or gas can be inserted into the chip through the inlet and outlet. The temperature controller can be connected through the heater contact areas to heat the sample and sample environment. The o-ring is used to seal the top and bottom chip. (b) Magnified view of the imaging window, showing the heater spiral and the thinned 20 nm imaging areas. TEM imaging is limited to these areas, while X-ray imaging on the beamline can be done anywhere on the window.
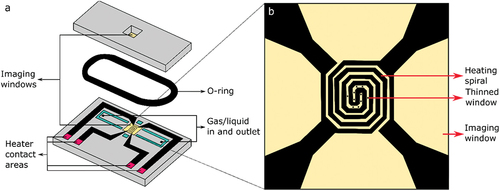
Figure 2. The hard x-ray nanoprobe end station. Photograph showing the I14 beamline setup inside the experimental hutch. The light path of the x-rays is indicated, along with the detectors, sample holder position, scanning stage and the detector table.
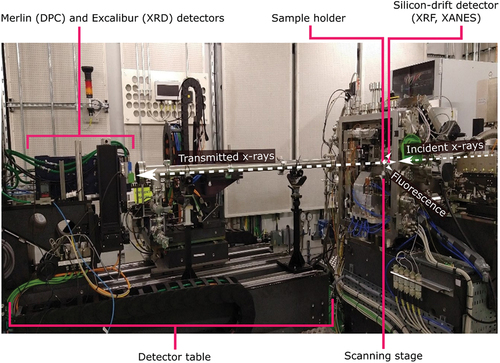
Figure 3. Corrosion in iron metal. XRF images, Fe-Ka signal, of iron metal film exposed to brine solution, imaged on the I14 beamline using the in situ liquid setup. XANES measurements are performed in between the XRF measurements, in the area that is outlined in the 3h panel by a rectangle of white dashed lines, thus this area has been exposed to a higher X-ray dose. This demonstrates that the corrosion reaction is accelerated by the effects of the X-rays.