Figures & data
Figure 1. (a) MarM 509 exposed at 700 °C in air for 100 hours with no deposit. (b) MarM 509 exposed at 700 °C for 100 hours in 8.5 vol.% O2, 10.5 vol.% CO2, 5 vol.% H2O and 90 ppm SOx with 80/20 Na2SO4/K2SO4 at 1.5 µg/cm2/h [Citation4].
![Figure 1. (a) MarM 509 exposed at 700 °C in air for 100 hours with no deposit. (b) MarM 509 exposed at 700 °C for 100 hours in 8.5 vol.% O2, 10.5 vol.% CO2, 5 vol.% H2O and 90 ppm SOx with 80/20 Na2SO4/K2SO4 at 1.5 µg/cm2/h [Citation4].](/cms/asset/35170df1-5ec7-4246-a2a6-d9ced3e6e646/ymht_a_2219877_f0001_c.jpg)
Figure 2. Test furnace apparatus [Citation8].
![Figure 2. Test furnace apparatus [Citation8].](/cms/asset/74efeb94-7633-4ca3-8a2f-f0b4c31da060/ymht_a_2219877_f0002_c.jpg)
Table 1. Nominal alloy elemental compositions wt.% (at.%) [Citation11].
Figure 3. Cumulative probability of change in good metal plots for PWA 1483 (top) and MarM 509 (bottom). Exposure carried out at 700 °C in an air atmosphere with 300 ppm SO2. The deposit flux was 1.5 µg/cm2/h of 80/20 (Na/K)2SO4 modified with additions of 1.5 µg/cm2/h of Mo.
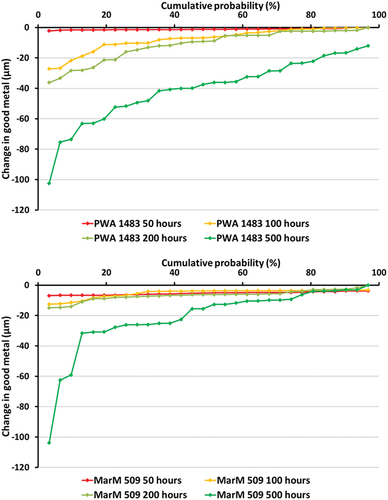
Figure 4. Median (top) and 4% (bottom) probability of metal loss exceedance plots. Exposure carried out at 700 °C in an air atmosphere with 300 ppm SO2. The deposit flux was 1.5 µg/cm2/h of 80/20 (Na/K)2SO4 either modified with 1.5 µg/cm2/h of molybdenum or unmodified [Citation8].
![Figure 4. Median (top) and 4% (bottom) probability of metal loss exceedance plots. Exposure carried out at 700 °C in an air atmosphere with 300 ppm SO2. The deposit flux was 1.5 µg/cm2/h of 80/20 (Na/K)2SO4 either modified with 1.5 µg/cm2/h of molybdenum or unmodified [Citation8].](/cms/asset/edbfae9c-8fee-46e2-be2f-2e09963d930d/ymht_a_2219877_f0004_c.jpg)
Figure 5. BSE images for PWA 1483 (left) and MarM 509 (right) showing areas both representative of the majority of the sample and also extreme corrosion features.
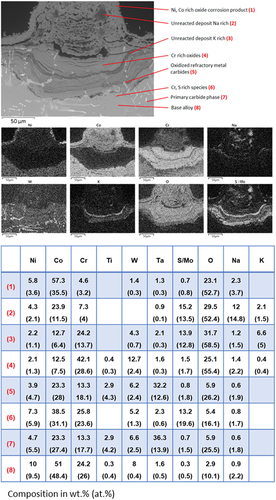
Figure 6. BSE image with point analysis and EDX element map of a corrosion feature on PWA 1483 after 500 hours of exposure at 700 °C in an air atmosphere with 300 ppm SO2. The deposit flux was 1.5 µg/cm2/h each of 80/20 (Na/K)2SO4 and Mo..
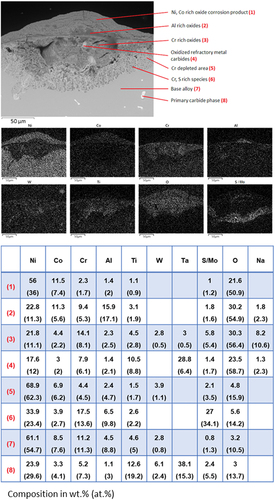
Figure 7. BSE image with point analysis and EDX element map of a corrosion feature on MarM 509 after 500 hours of exposure at 700 °C in an air atmosphere with 300 ppm SO2. The deposit flux was 1.5 µg/cm2/h each of 80/20 (Na/K)2SO4 and Mo..