Figures & data
Table 1. Chemical composition (wt ppm, bal. Cu) of the studied OFP copper material.
Figure 1. Four RVEs used in computations: (a) simplified model with 64 grains, (b) simplified model with 512 grains, (c) 250 grain synthetic polycrystalline, and (d) finite element mesh with EBSD-based grain structure.
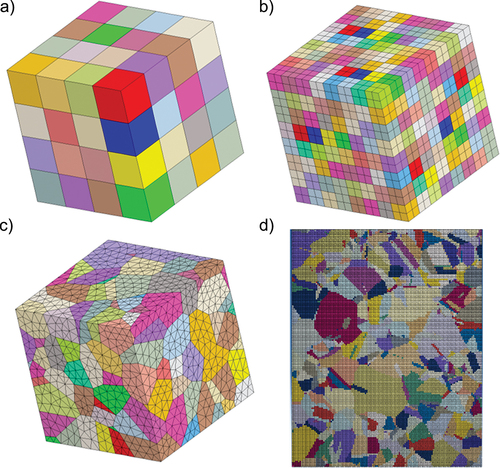
Figure 2. Representative SEM-EBSD image of the creep relaxation sample with orientation distribution figures and grain size distribution.
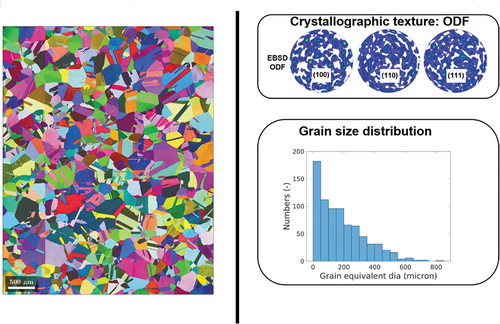
Figure 3. Models’ stress–strain response (dashed lines) compared to experimental test curves (solid lines). 180 µm curve is shown only in a). Curves produced without damage are shown in a), and curves with damage are in c), and average dislocation density evolution during the loading (in model) is presented in b). EBSD-based model stress–strain response is presented in d).
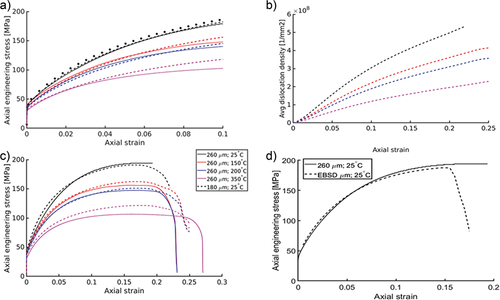
Table 2. List of parameters and initial conditions.
Figure 4. Polycrystalline model (creep) relaxation behaviour compared to experiential test at 50°C with a constant 0.5% strain.
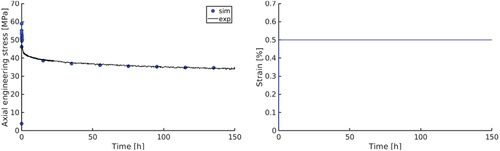
Figure 5. (a and b) Polycrystalline model creep behaviour compared to experimental data. (c) Creep response of the copper material at 150°C with a constant load of 120 MPa.
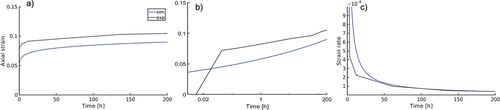
Figure 6. (a) A faceted creep cavity in a grain boundary triple junction of OFP copper sample. (b) Several, potentially coalesced cavities partially covered by lid due to sample preparation in a grain boundary of OFP copper sample.
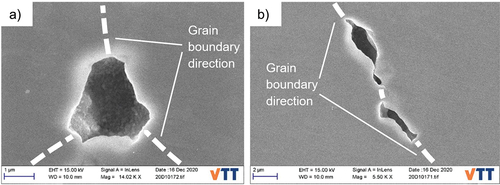
Figure 7. IPF-Z map of the CPFE model used in damage simulation. The evolution of crystallographic orientation (shown by disorientation angle) is compared with damage for (a) 10%, (b) 12.5%, and (c) 17.5% for the CPFE model. (d) The IPF-Z EBSD map of the damaged sample, which is compared with the variation in crystallographic orientation (shown by disorientation angle) at different locations with respect to the mean grain orientation.
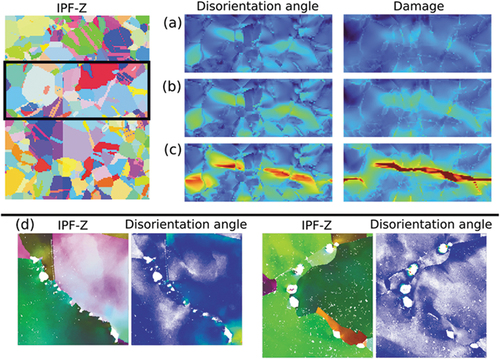
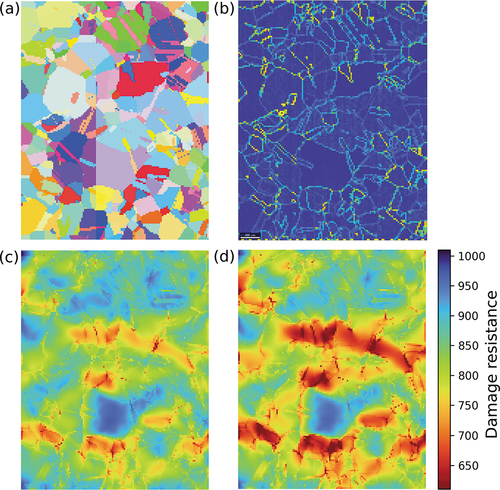
Figure 8. (a) The original grain map (used in EBSD-based mesh). (b) The normalised magnitude of the TF gradient (in loading direction). (c and d) The damage resistance at 10% and 12.5% macroscopic strain, respectively.