Figures & data
Figure 1. Relationship between stress and creep life in NIMS data [Citation22].
![Figure 1. Relationship between stress and creep life in NIMS data [Citation22].](/cms/asset/2506e201-3b91-4980-835d-ab7e4065860f/ymht_a_2305498_f0001_c.jpg)
Figure 2. Relationship between minimum strain rate and stress in NIMS data [Citation22].
![Figure 2. Relationship between minimum strain rate and stress in NIMS data [Citation22].](/cms/asset/0e1c4e7b-8e6a-4e14-90fd-b616d6b19be3/ymht_a_2305498_f0002_c.jpg)
Figure 3. Regression analysis of data by power law.
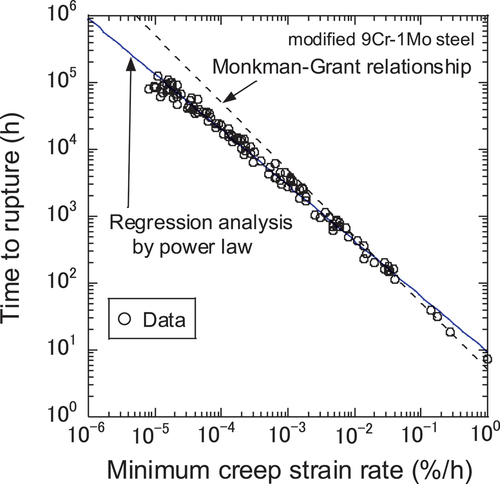
Figure 4. Comparison of creep life of data and estimated results at 600 °C.
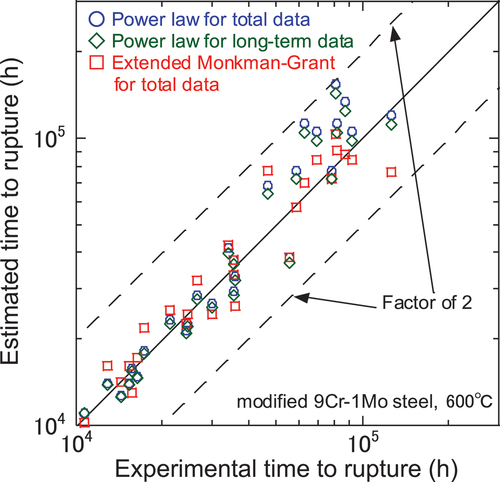
Figure 5. Regression analysis of long-term data by power law.
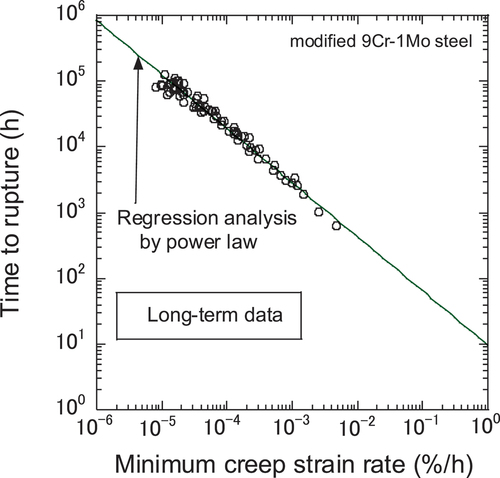
Figure 6. Relationship between minimum strain rate and time to rupture of NIMS heat MGC.
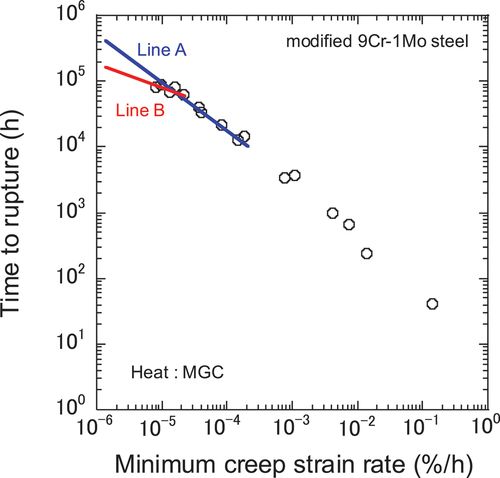
Figure 7. Relationship between ductility and time to rupture.
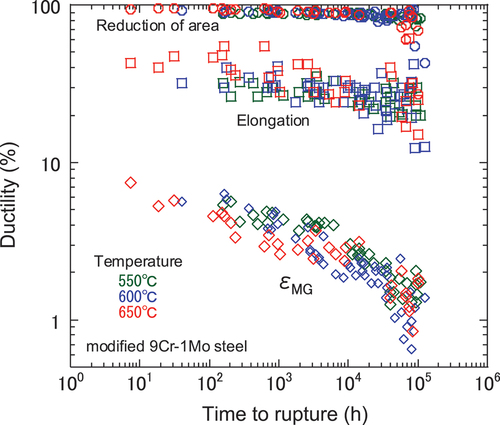
Figure 8. Relationship between ductility and minimum strain rate.
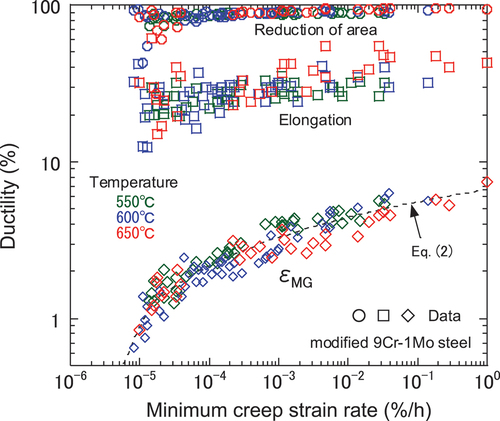
Figure 9. Relationship between ductility and stress.
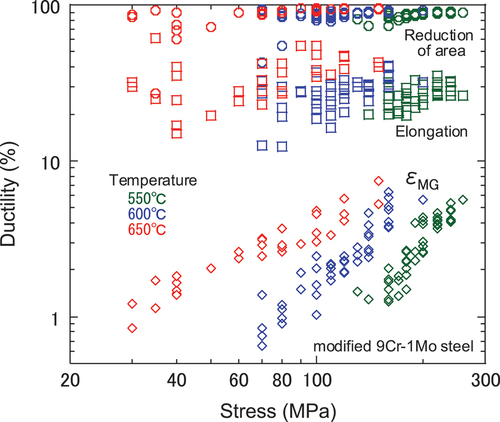
Figure 10. Relationship between εMG and elongation.
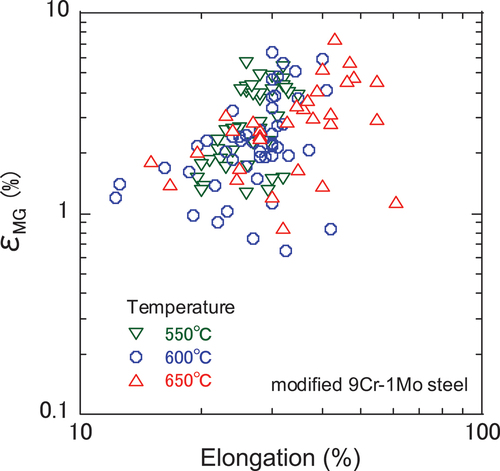
Figure 11. Relationship between εMG and reduction of area.
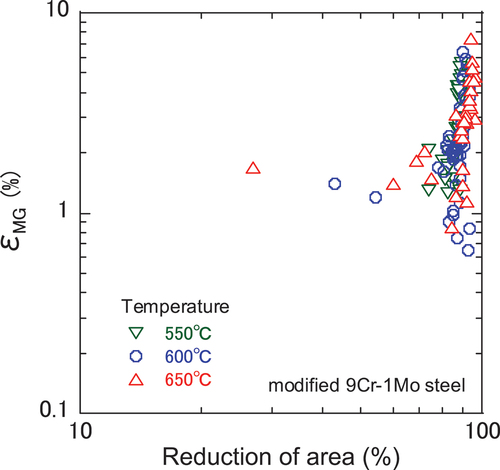
Figure 12. Modelling of dependence of εMG on temperature and stress.
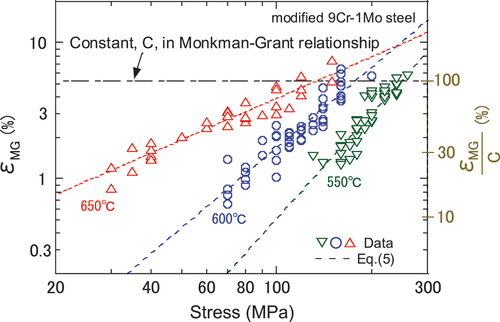
Figure 13. Comparison of experimental εMG and calculated εMG.
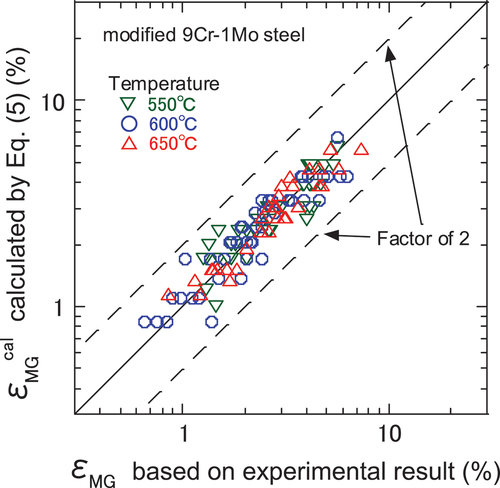
Figure 14. Schematic of assessment by extended monkman-grant relationship: stress 100 MPa.
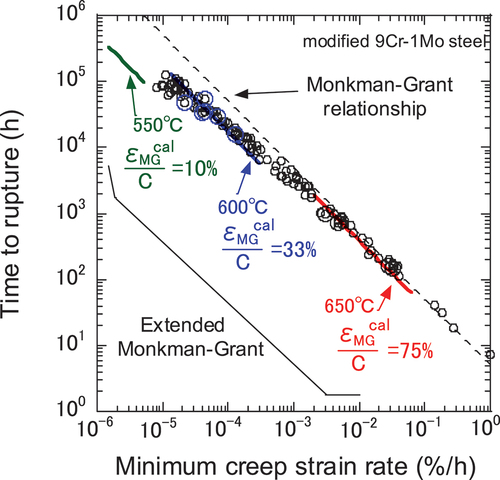
Figure 15. Schematic of assessment by extended monkman-grant relationship: temperature 600 ℃.
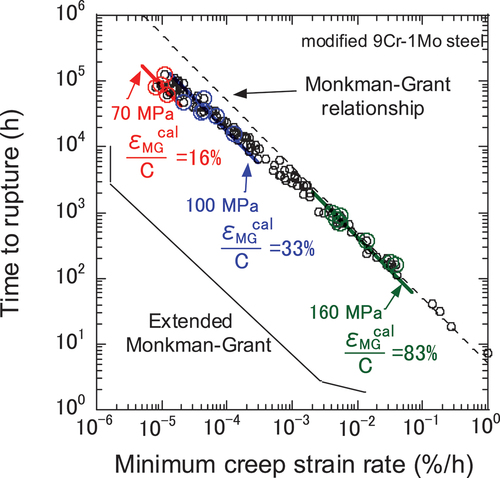
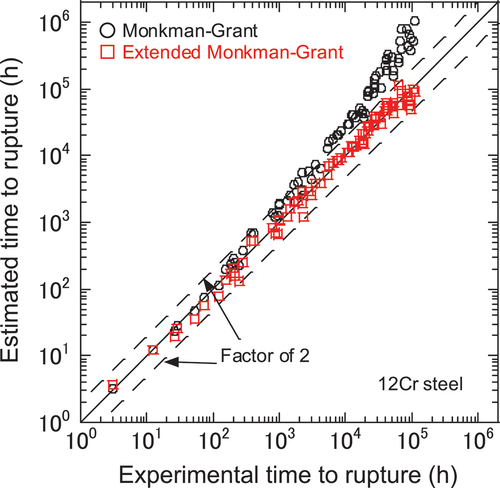
Figure 16. Comparison of creep life of data and estimated results by extended monkman-grant relationship.
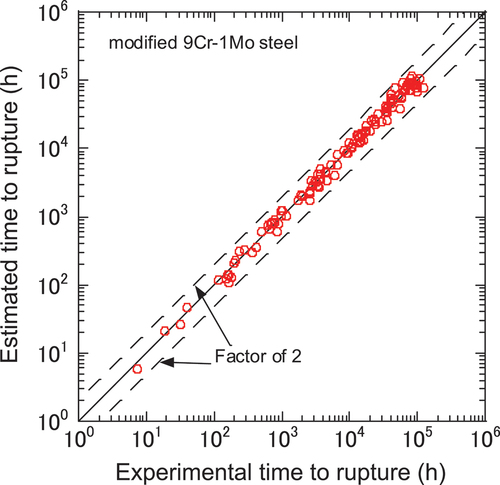
Figure 17. Comparison of 12Cr [Citation24] and mod.9Cr-1Mo [Citation22] steels regarding relationship between stress and creep life.
![Figure 17. Comparison of 12Cr [Citation24] and mod.9Cr-1Mo [Citation22] steels regarding relationship between stress and creep life.](/cms/asset/65e73af7-2e49-4020-b7e3-49417fed754e/ymht_a_2305498_f0017_c.jpg)
Figure 18. Comparison of 12Cr and mod.9Cr-1Mo steels regarding relationship between minimum creep strain rate and creep life.
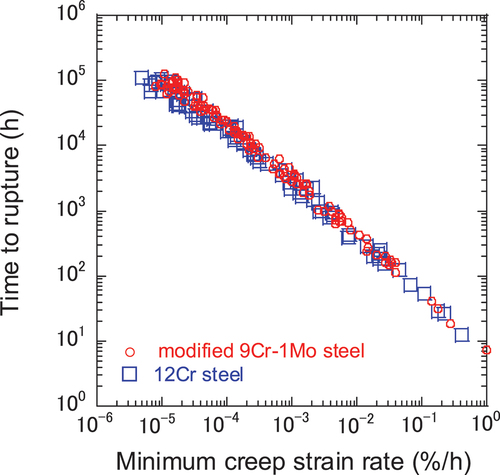
Figure 19. Dependence of εMG on temperature and stress in 12Cr steel.
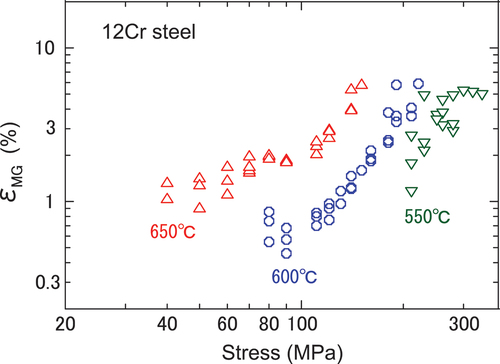
Figure 20. Comparison of creep life of 12Cr steel data and estimated results by conventional and extended monkman-grant relationship.