Figures & data
Table 1. Description of the study buildings.
Table 2. Summary of BUS study results.
Table 3. Selected thermal comfort field study (TCS) survey results for Indian study buildings.
Figure 1. Cross-sectional views of the study buildings.
Figure 2. Scatter plot showing BUS ratings for ‘temperature in summer hot/cold’ versus ‘temperature in summer overall’.
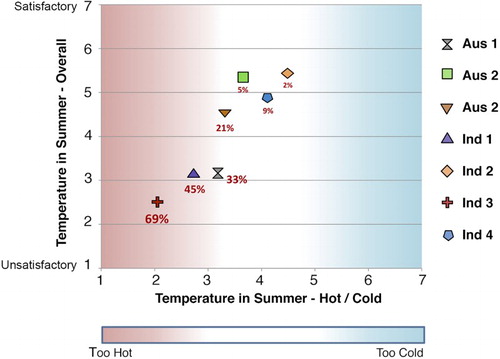
Figure 3. Predicted cooling energy at different cooling set-points for Sydney and Melbourne (north) and Delhi and Ahmedabad (south).
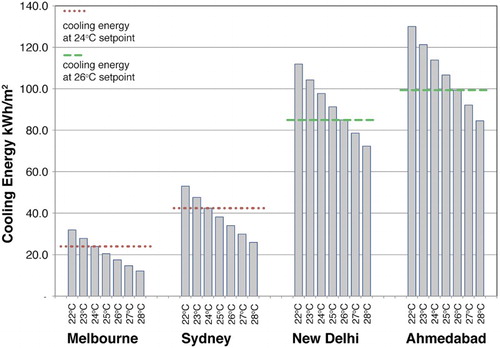
Figure 4. Scatterplots showing the relationship between ratings for (a) perceived control over cooling and (b) effectiveness of response with ratings for temperature in summer overall.
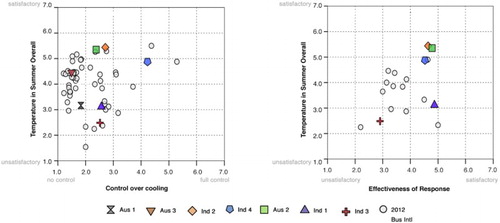
Figure 5. Statistical correlation showing the strength of the relationship between ratings for (a) temperature in summer overall and comfort overall, (b) temperature in summer overall and perceived productivity, (c) comfort overall and perceived productivity, and (d) comfort overall and perceived health. (a–d) show the study buildings in the context of the wider BUS dataset. The regression line is for the whole set.
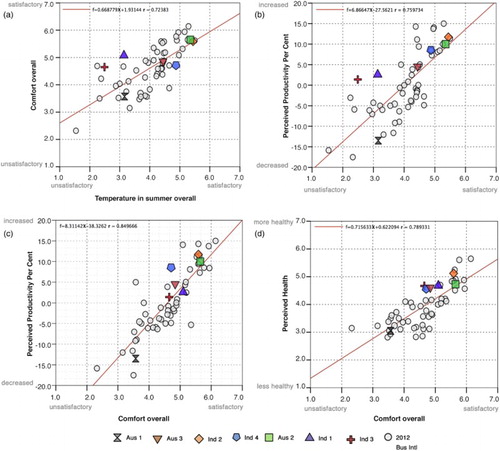
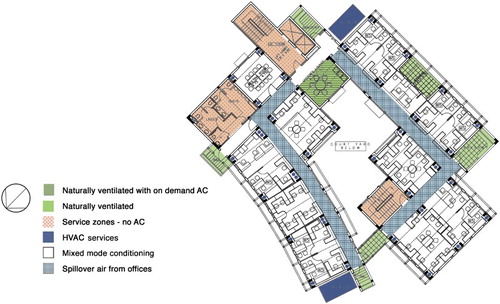
Figure 6. Layout plan showing zones of environmental control for Aus3.
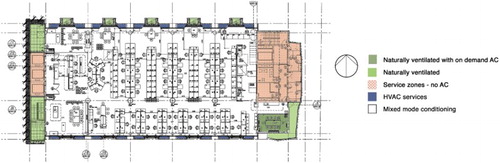
Figure 7. Layout plan showing zones of environmental control for Ind1.