
Figures & data
Figure 1. IEQ measurement instrumentation.
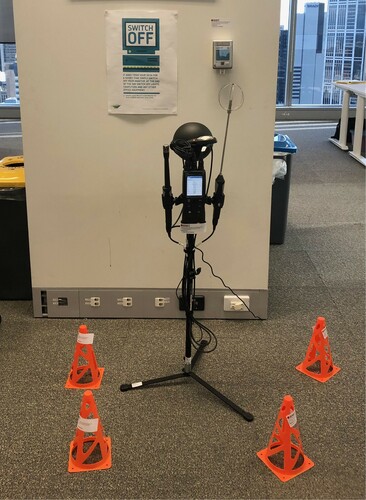
Table 1. Instrument description.
Figure 2. Facades of three building types. Image source: RMIT University.
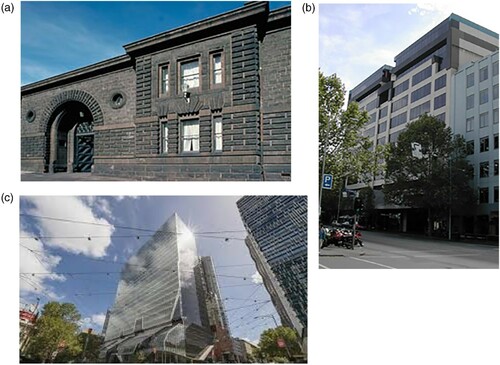
Table 2. Building characteristics.
Table 3. Building envelope and HVAC system details.
Figure 3. Temperature and RH (a) and (b) CO2 concentration measured inside the offices.
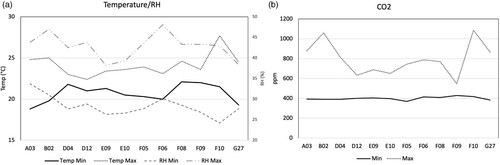
Figure 4. Lighting levels (a) and sound levels (b).
Note. No sound levels were measured in the buildings A and B.
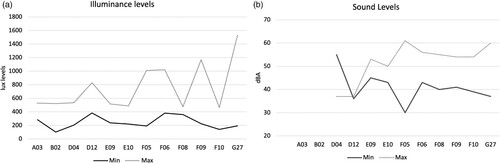
Table 4. PMV, PPD and thermal comfort compliance (met: 1.2, clo:0.61).
Figure 5. Occupant perception of indoor condition parameters.
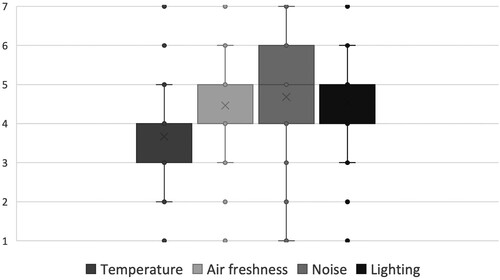
Figure 6. Overall comfort and satisfaction and perceived productivity.
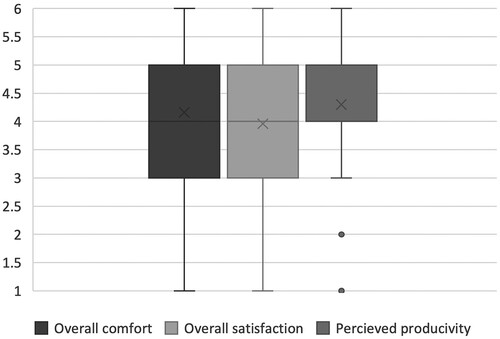
Table 5. Correlations between subjective and objective assessments.
Table 6. Welch’s F test for indoor environment by three building types.
Table 7. Post hoc results for indoor environment by three building types.
Table 8. Welch’s F test for spatial comfort and amenities by three building types.
Table 9. Post hoc results for spatial comfort and amenities by three building types.
Table 10. Welch’s F test for overall comfort and satisfaction in the workplace.
Table 11. Post hoc results for overall comfort and satisfaction by three building types.