
Figures & data
Figure 1. Research workflow.
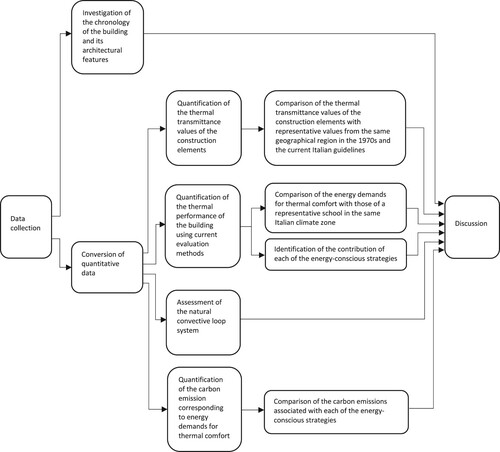
Table 1. Overview of the data: source and use in the study.
Figure 2. Plan of roof garden (top right), plan of the upper level (top left), west–east sections (bottom). Sergio Los and Natasha F. Pulitzer, Kindergarten, Crosara, Italy, 1972–78 (Source: Synergia Progetti archive: Sergio Los, Natasha F. Pulitzer).
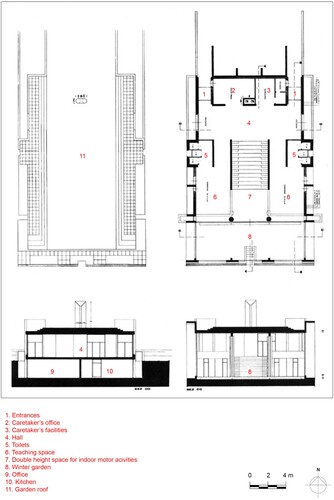
Figure 3. Eastern facade. Sergio Los and Natasha F. Pulitzer, Kindergarten, Crosara, Italy, 1972–78. (Source: Synergia Progetti archive: Sergio Los, Natasha F. Pulitzer).
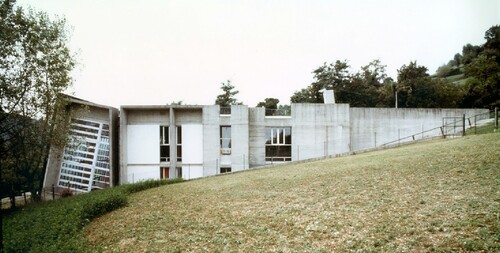
Figure 4. View of the central staircase, connecting the main entrance hall (on the upper level) to the double-height hall and the winter garden (on the lower level). Sergio Los and Natasha F. Pulitzer, Kindergarten, Crosara, Italy, 1972–78 (Source: Synergia Progetti archive: Sergio Los, Natasha F. Pulitzer).
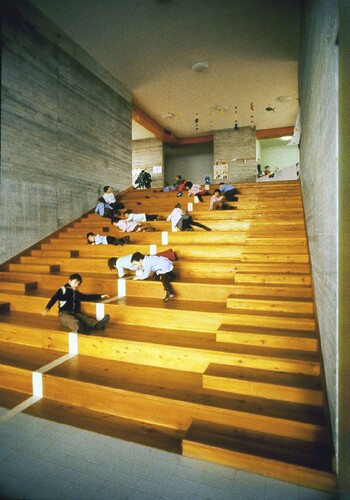
Figure 5. Indoor view of the winter garden, located in the southern part of the building. Sergio Los and Natasha F. Pulitzer, Kindergarten, Crosara, Italy, 1972–78 (Source: Synergia Progetti archive: Sergio Los, Natasha F. Pulitzer).
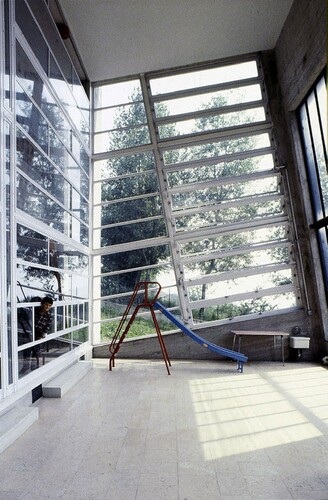
Figure 6. View from the rooftop garden towards the south. Sergio Los and Natasha F. Pulitzer, Kindergarten, Crosara, Italy, 1972–78 (Source: Synergia Progetti archive: Sergio Los, Natasha F. Pulitzer).
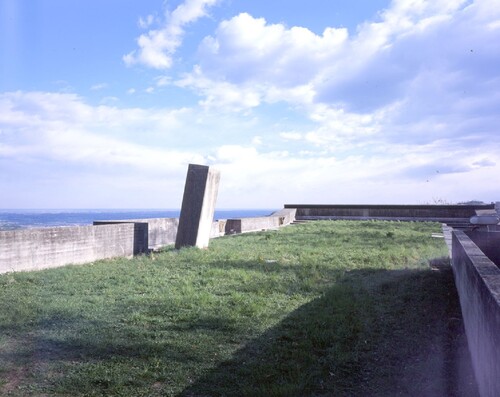
Figure 7. View of the solar thermal collectors on the southern façade. Sergio Los and Natasha F. Pulitzer, Kindergarten, Crosara, Italy, 1972–78 (Source: Synergia Progetti archive: Sergio Los, Natasha F. Pulitzer).
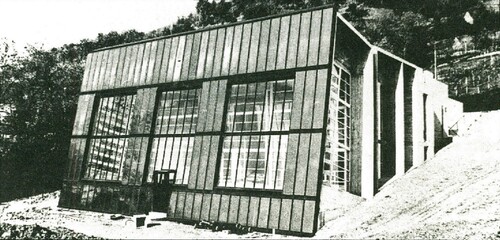
Table 2. Comparison between calculated U values for the kindergarten in Crosara, reference U values for buildings in the Veneto region (Italy) between 1970 and 1989 (UNI TS, 11300-Citation1, Citation2008) and minimum U values required for new buildings built in the same Italian climate zone after 2021 (D.M. 2015).
Figure 8. Energy demands of the kindergarten according to the design calculations and supply systems, based on the design performance of the thermal solar system (Data source: Synergia Archive: Sergio Los, Natasha F. Pulitzer).
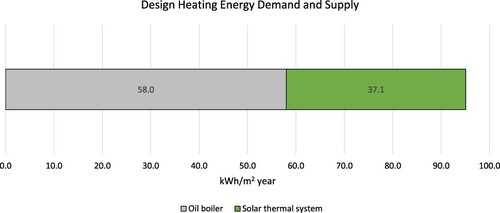
Figure 9. Thermal losses of the kindergarten by source using data from the thermophysical calculation of the energy balance.
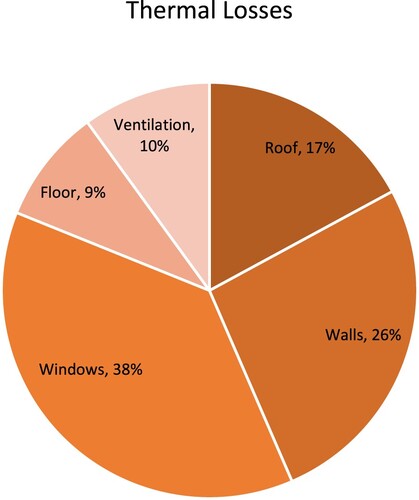
Figure 10. The kindergarten’s energy inputs by source: data from the thermophysical calculation of the energy balance (inner ring) and the thermal energy supplied by the two heating systems based on the oil boiler consumption data (outer ring) (Funaro & D’Errico, Citation1992).
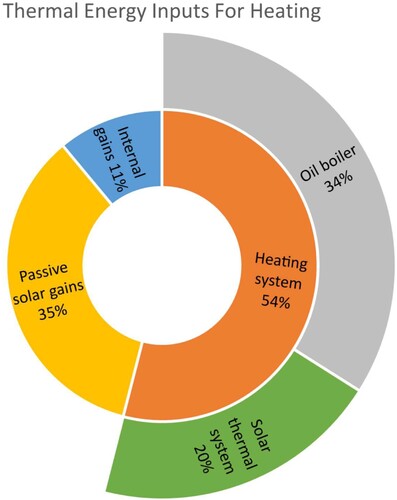
Figure 11. Scheme of the kindergarten. The portion of the building involved in the natural air circulation flux activated by the passive solar system is shown in grey: (A) windows (240 by 60 cm) in the upper part of glazed curtain wall between the two thermal zones, (B) inlets (35 by 15 cm) at the bottom of the upper floor, (C) outlets (25 by 10 cm) located underneath the curtain wall.
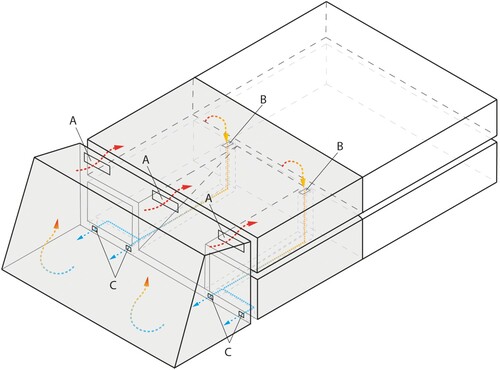
Figure 12. Images from the CFD analysis representing the velocity vector, velocity contour and filled temperature contour: vertical section AA through one upper window and one lower outlet, showing the air passing from the winter garden to the heated space and the air brought back to the winter garden at the ground floor level (top left); vertical section BB through one of the floor inlets in the upper floor showing the air collected from the heated space (top right); horizontal section through the upper windows showing the air passing from the winter garden to the heated space (bottom left); horizontal section through the lower outlets showing the air brought back to the winter garden at the ground floor level (bottom right).
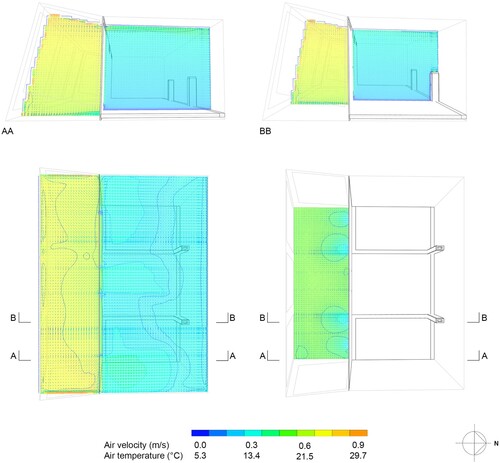
Figure 13. CO2 emissions from heating (a) the kindergarten of Crosara with a functioning thermal solar system, using measured data (Funaro & D’Errico, Citation1992); (b) the kindergarten of Crosara without a thermal solar system, using calculated data; (c) a representative school in the same climate zone, using data calculated from available data (Corrado et al., Citation2016); (d) a comparative scenario, using the calculated heating demand of case (c), minus the final energy provided for heating by the thermal solar system of the kindergarten in Crosara (calculated subtracting (a) from (b)); (e) the EU 2008 average (EEA, Citation2012).
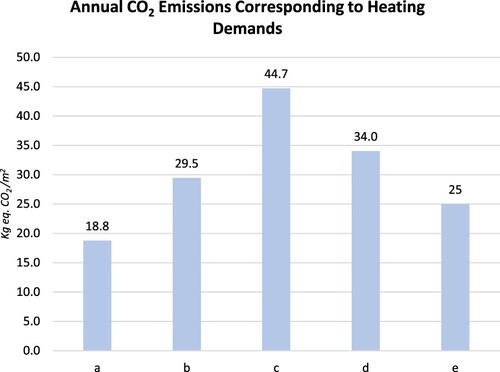
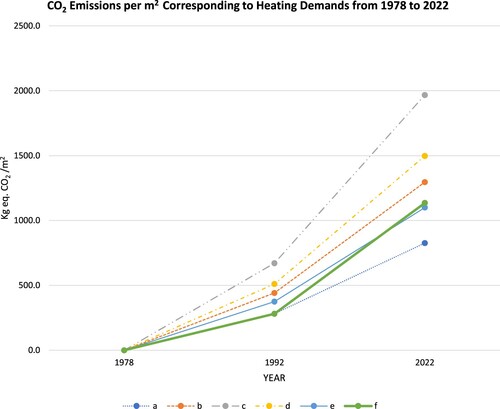
Figure 14. Calculated CO2 emissions from heating between 1978 and 2022 for (a) the kindergarten of Crosara with a functioning thermal solar system, using measured data (Funaro & D’Errico, Citation1992); (b) the kindergarten of Crosara without the thermal solar system, using calculated data; (c) a representative school in the same climate zone, using data calculated from available data (Corrado et al., Citation2016); (d) a comparative scenario, using the calculated heating demand of case (c), minus the final energy provided for heating by the thermal solar system of the kindergarten in Crosara (calculated subtracting (a) from (b)) (e) the EU 2008 average (EEA, Citation2012); (f) an assumed scenario of the kindergarten of Crosara with the de-activated solar thermal system after 1992, using measured data until 1992, and then calculated data.
Data availability statement
Data sharing is not applicable to this article.
Acknowledgements
Archive material by courtesy of Synergia Progetti (Sergio Los and Natasha Finali Pulitzer). The authors thank Sergio Los and Natasha Finali Pulitzer for access to their archive and assistance during the research. The case study of the research presented in this paper has been analysed in the context of a PhD research project carried out by Elena Poma under the supervision of Prof. Franz Graf at Università della Svizzera italiana, Accademia di architettura.