
Figures & data
Table 1. Summary of the literature review on the overheating risk through field measurements.
Figure 1. The cities in the Helsinki Region [43].
![Figure 1. The cities in the Helsinki Region [43].](/cms/asset/de762ccf-43d5-4c61-b408-c72934331d58/rbri_a_2253338_f0001_oc.jpg)
Figure 2. The changes in Finnish building codes over time.
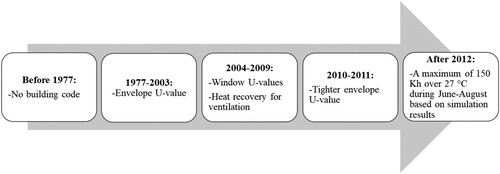
Figure 3. The number and share of apartments in categorized design years.
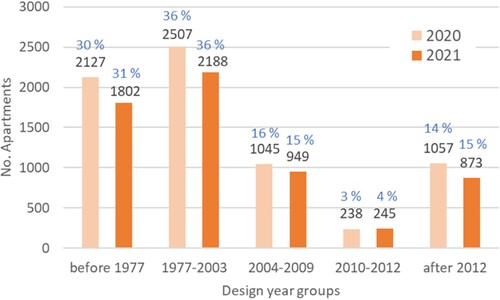
Figure 4. The number of apartments in different apartment type categories.
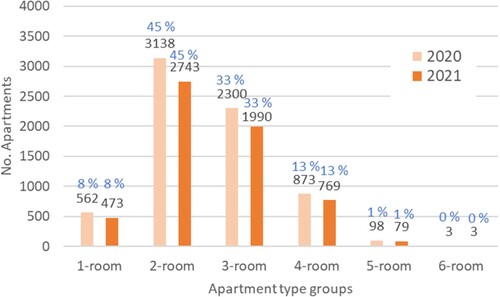
Table 2. Statistics of the mean outdoor air temperature at the Helsinki-Vantaa weather station in summers (between May 15 and August 31) 1989–2021.
Figure 5. Outdoor daily mean, maximum, and minimum temperature during the summers of 2020 and 2021.
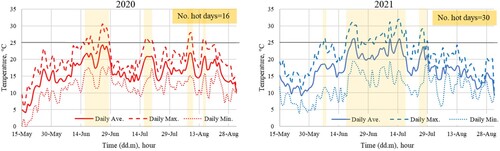
Figure 6. Global radiation during the summers of 2020 and 2021.
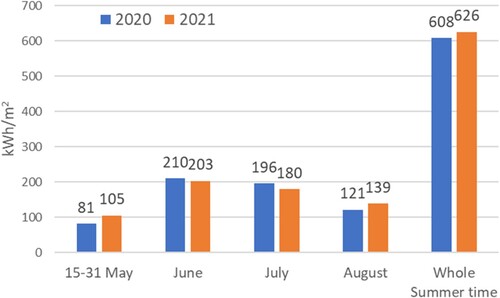
Figure 7. The percentage of apartments with the maximum hourly temperature of the summer above 27°C, 30°C, and 32°C. 6,974 apartments in 2020 and 6,056 apartments in 2021 are analyzed.
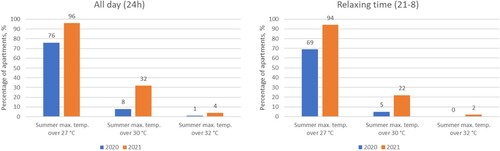
Figure 8. Degree hours above 27°C, 30°C, and 32°C for 98% of the apartments during the whole summer of 2020 and 2021.
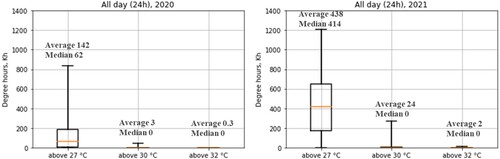
Figure 9. Degree hours above 27°C, 30°C, and 32°C for 98% of the apartments during the relaxing time (21:00–8:00) of the whole summer in 2020 and 2021.
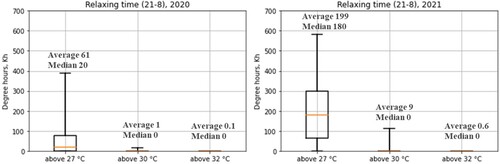
Figure 10. Degree hours above 27°C, 30°C, and 32°C for different design year categories.
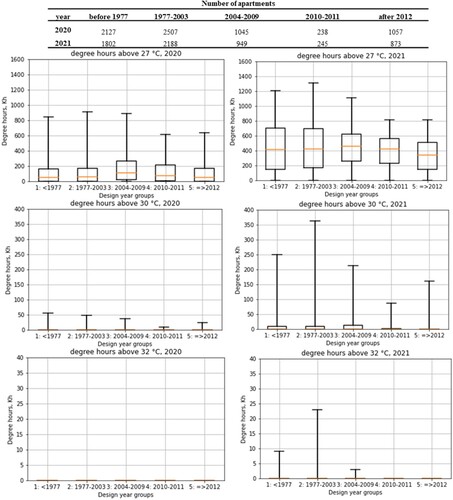
Table 3. Post hoc test results of statistically significant differences for degree hours above 27°C in different design year groups. (The values in the brackets are P-value results.)
Figure 11. Degree hours above 27°C, 30°C, and 32°C for different apartment type categories.
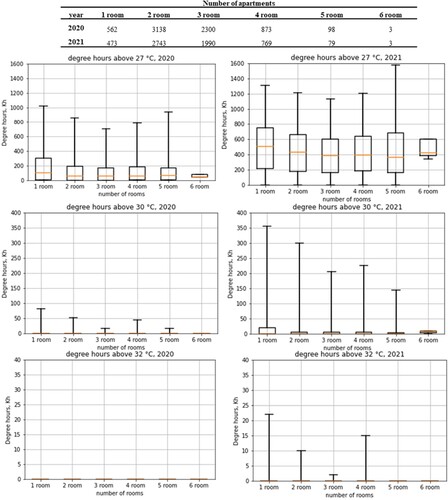
Table 4. Post hoc test results of statistically significant differences for degree hours above 27°C in different types of apartments. (The values in the brackets are P-value results.)
Figure 12. Degree hours above 27°C, 30°C, and 32°C for different area groups.
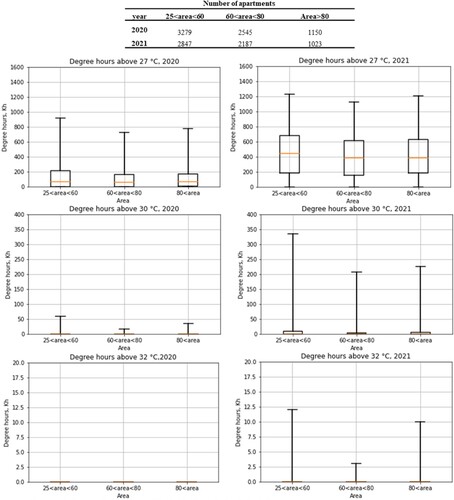
Table 5. Post hoc test results of statistically significant differences for degree hours above 27°C in different area categories (The values in the brackets are p-value results).