Figures & data
Table 1. Summary of the characteristics of the three studied buildings adapted from (Khoshbakht et al., Citation2019).
Table 2. Scale and response options of the real time thermal comfort survey adapted from (Khoshbakht et al., Citation2019).
Table 3. Rating scales for preference questions in the survey questionnaire.
Table 4. Summary of investigated rooms and subjective evaluations.
Figure 1. An illustration of the location of the measurement tools on building plans, (a) B1, (b) B2 and (c) B3, adapted from (Khoshbakht et al., Citation2019).
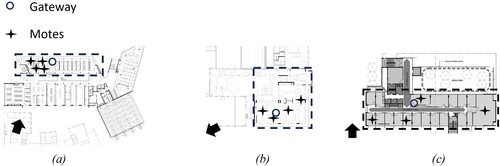
Table 5. Instruments used for indoor environmental quality measurements (Khoshbakht et al., Citation2019).
Table 6. Environmental characteristics of the three mixed-mode buildings.
Table 7. Distribution of the indoor operative temperature according to ASHRAE 55-2020 (ASHRAE Standards, Citation2020) adaptive thermal comfort of 80% and 90% acceptability limits during the survey periods.
Figure 2. Binned outdoor temperatures and TSV under NV and AC modes.
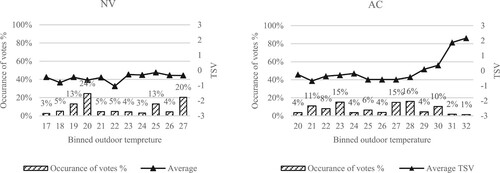
Figure 3. Thermal sensation votes regressed with temperature offset from neutrality, Tdiff = Top -Tn.
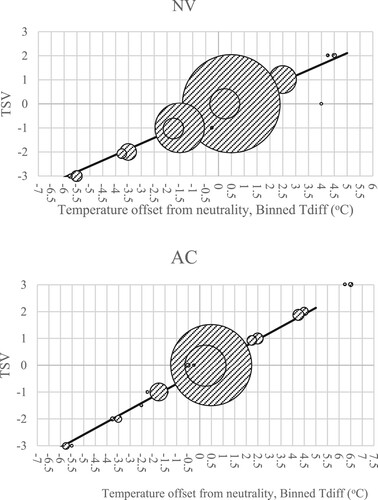
Figure 4. Participants’ thermal preferences have changed in response to thermal sensation. The lines show separate probit regression models that were fitted to the respondents’ ‘want cooler’ and ‘want warmer’ preferences.
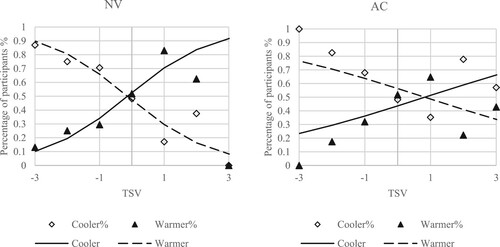
Figure 5. Probit regression of participants’ thermal preference (TP) against the temperature offsets from Neutral temperature (Tdiff).
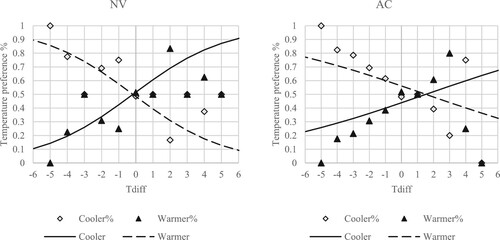
Figure 6. The percentage of dissatisfaction in relation to temperature offsets from neutral temperatures (Tdiff).
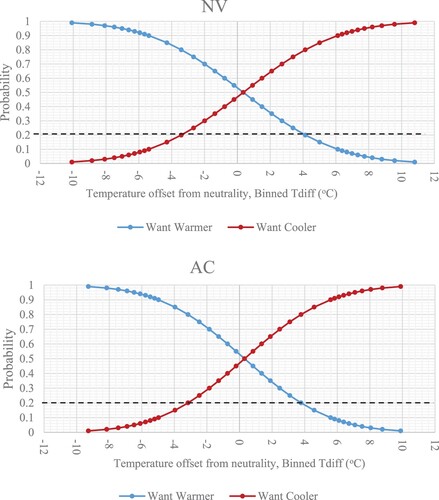
Figure 7. The correlation between indoor comfort temperature (Tcomf) and prevailing mean outdoor temperature Tpma(out).
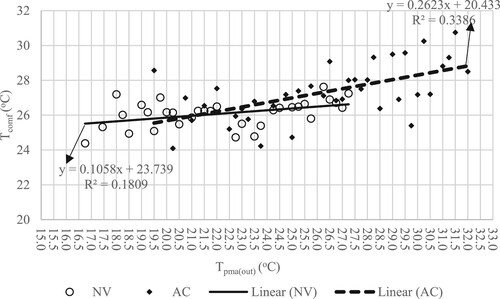
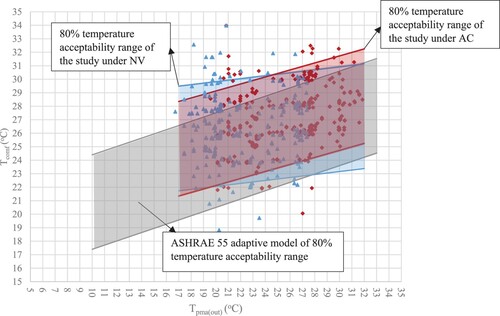
Figure 8. Comparison of the 80% temperature acceptability range of ASHRAE 55’s Adaptive model and the current study.