
Figures & data
Table 1. Example of cited (IEQ-related) national and international sets of weights related to thermal comfort (TC), air quality (AQ), acoustic comfort (AC) and visual comfort (VC) (cited from Fathi & O’Brien, Citation2023; Wei et al., Citation2020).
Table 2. Overview of the share of the IEQ-related evaluation domains (in percentage) of the total score in the DGNB system (new buildings) as a function of building type (based on Mahdavi et al., Citation2020).
Table 3. Comparison between weighting factors derived from field studies related to thermal comfort (TC), air quality (AQ), acoustic comfort (AC) and visual comfort (VC) (based on Danza et al., Citation2020).
Table 4. Overview of the five domains subjected to expert ranking, as well as ranking items within each domain.
Figure 1. Participants’ ranking of the five IEQ domains.
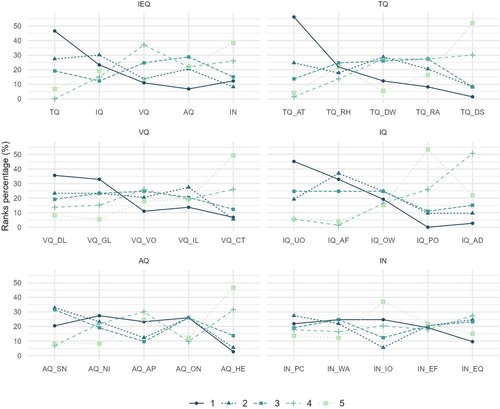
Figure 2. Participants’ ranking of the IEQ domains and their sub-categories (‘high’ denotes the percentage of votes ranking an item as either rank 1 or rank 2, whereas ‘low’ denotes the percentage of votes ranking an item as either rank 4 or rank 5).
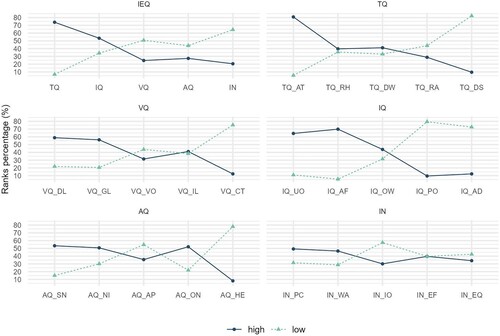
Table 5. Summary of participants’ ranking of IEQ domains as well as sub-categories in each domain subjected to expert ranking in terms of mean and standard deviation (Sd).
Table 6. Participants’ ranking (mean score) of the IEQ domains (and their sub-categories) broken down for various subsets of the participants, i.e. gender (female/male), profession (architect, engineer, educator/researcher), area of expertise (TQ, IQ, VQ) and location (Europe, Americas, Asia).
Table 7. Order of participants’ importance ranking of IEQ main domains and sub-categories based on: (i) destination as highest ranking, (ii) inclusion in highest and second highest ranking and (iii) mean ranking score.
Figure 3. Comparison of the percentage of participants who evaluated different IEQ domains as high (sum of rankings 1 and 2) by participants with different main area of expertise (i.e. thermal quality, visual quality, indoor air quality).
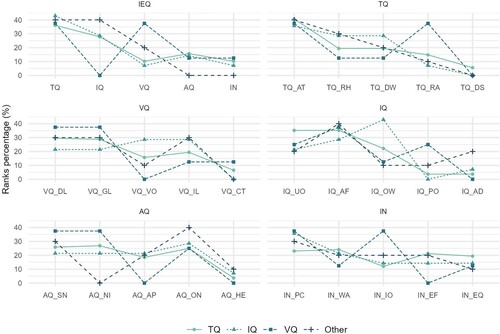
Figure 4. Comparison of the percentage of participants who evaluated different IEQ domains as high (sum of rankings 1 and 2) shown separately for female and male participants.
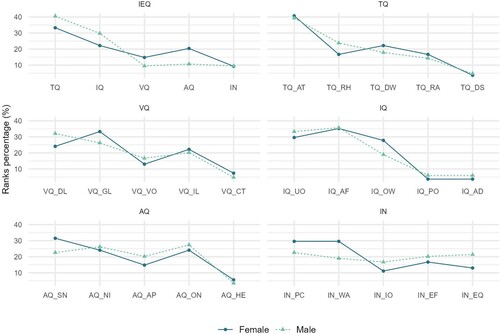
Figure 5. Comparison of the percentage of participants who evaluated different IEQ domains as high (sum of rankings 1 and 2) by participants with different professional background (i.e. architects, educators/researchers, engineers).
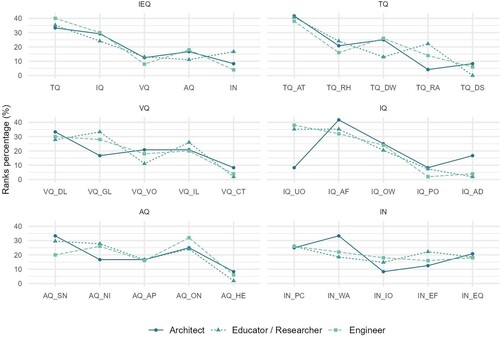
Figure 6. Comparison of the percentage of participants who evaluated different IEQ domains as high (sum of rankings 1 and 2) by participants from different locations (Europe, Americas, Asia).
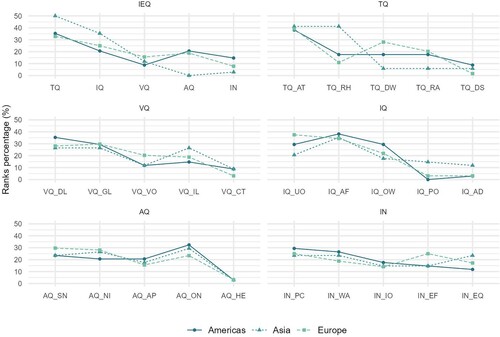
Figure 7. The assignment of weights (y-axis) based on participants’ mean ranking tendency (x-axis).
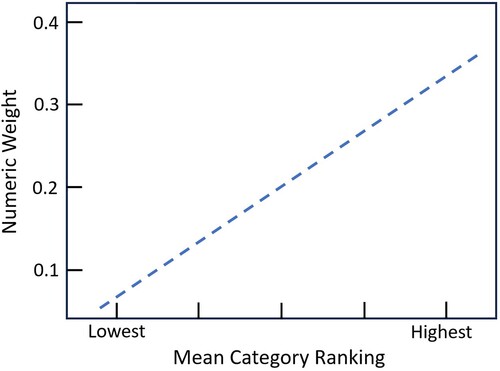
Table 8. Weights derived for the five IEQ domains and the respective sub-categories in each domain based on participants’ corresponding mean ranking votes (the numeric values of the weights in each category are derived in a manner so as to add to one).