Figures & data
Figure 1. Africa RISING research kebeles in the Ethiopian highlands.
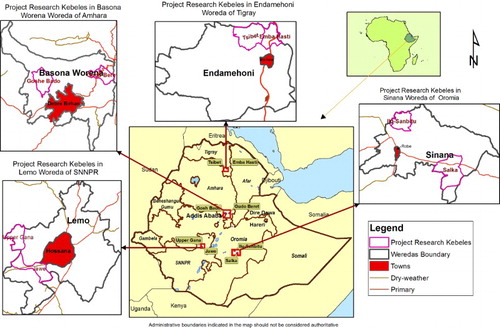
Table 1. Location and characterisation of PCAs by region, woreda, and kebele, showing the number of participants.
Table 2. Criteria for assessing household differences identified during the PCA by participants.
Figure 2. Number of times a livelihood source was prioritised and described as stable, improving, or declining across kebeles.
Table 3. Main livelihood trends by region and kebele.
Table 4. Crop preference ranking for cash by men/women/youth and kebele (1 = highest rank).
Table 5. Crop preference ranking for food security by men/women/youth and kebele (1 = highest rank).
Table 6. Livestock preference ranking by men/women/youth and kebele (1 = highest rank).
Figure 3. Crop production challenges across kebeles.
Figure 4. Livestock production challenges across woredas.
Table 7. Priorities for future interventions and monitoring.
Figure 5. Institutions identified as important for agriculture, ranked by percentage of respondents (men, women, and youth).