Figures & data
Figure 1. Time use assessment framework of women’s time allocation in the VRAEM, Peru.
Notes: Framework based on the System of National Accounts (SNA Citation2009), the international framework that measures and defines work. Paid SNA work refers to market production (income-generating activities) and non-market subsistence production. Unpaid non-SNA work refers to reproductive and volunteer activities. Adapted from Blackden and Wodon (Citation2006).
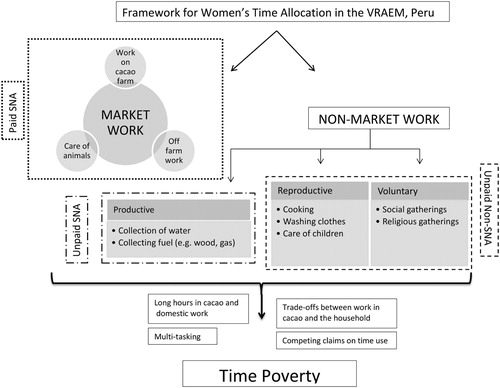
Figure 2. Study areas in Peru. Map data provided by Google Maps.
Notes: A: Río Tambo; B: San Martín de Pangoa; C: Canayre; D: Pichari; E: Kimbiri; F: Echarate.
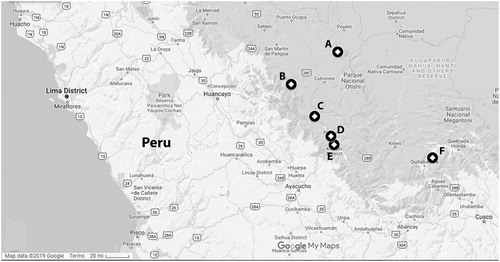
Table 1. Geographic location of sampled households.
Table 2. Description of variables used in the empirical models.
Figure 3. Daily time spent on various activities from a survey of women in the VRAEM, Peru.
Notes: n = 45. Average total time use during the day is 971 min or 16.2 h. Numbers are reported as the mean; time does not include sleep.
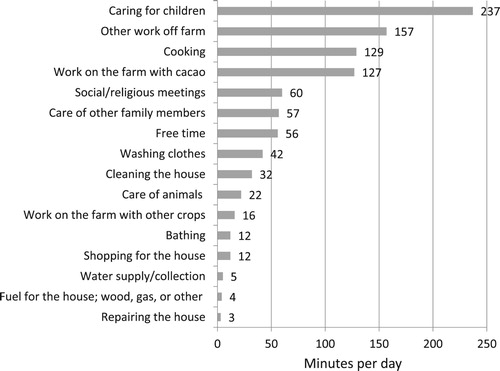
Table 3. Time dedicated to economic activity and work from a survey of women in the VRAEM, Peru (minutes per day).
Table 4. Total number of women who performed each activity.
Table 5. Coefficients and average marginal effects on women’s workload and interest in participating in cacao production.
Table 6. Coefficients of demographic characteristics for OLS regression of time in minutes spent on different livelihood activities.
Figure 4. Level of interest in cacao production from a survey of women in the VRAEM, Peru.
Notes: n = 45. Over 80% of women were either very interested or interested in cacao production.
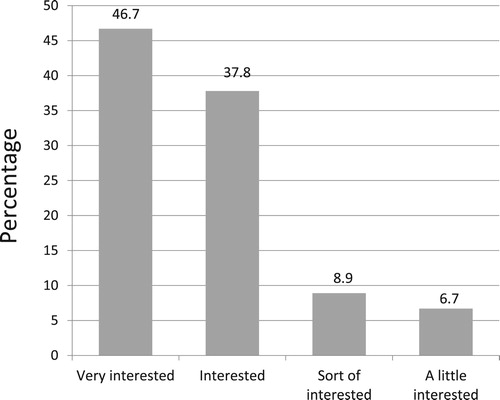
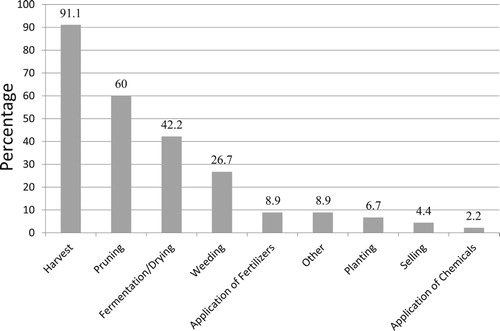
Figure 5. Participation in cacao activities from a survey of women in the VRAEM, Peru.
Notes: n =45. Harvesting, pruning, and fermentation (drying) are activities with the highest participation.