Figures & data
Figure 1. Market map developed by Practical Action Consulting and EUEI PDF (Citation2015).
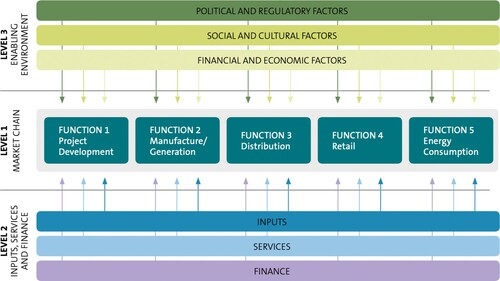
Figure 2. Nepal biomass ICS modified market map and policy framework.
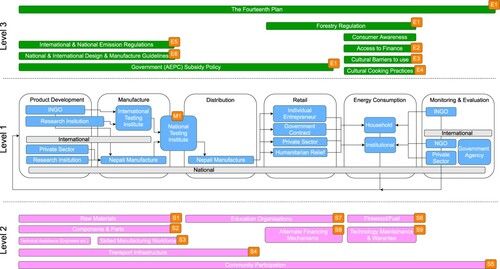
Figure 3. Milk sweet industry (left) and paper making industry (right).
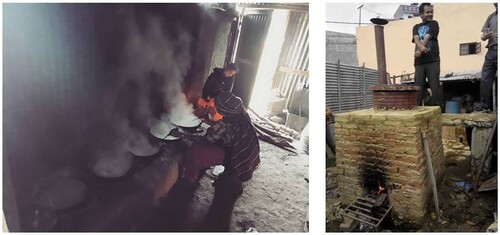
Figure 4. Biomass cookstove distribution network.
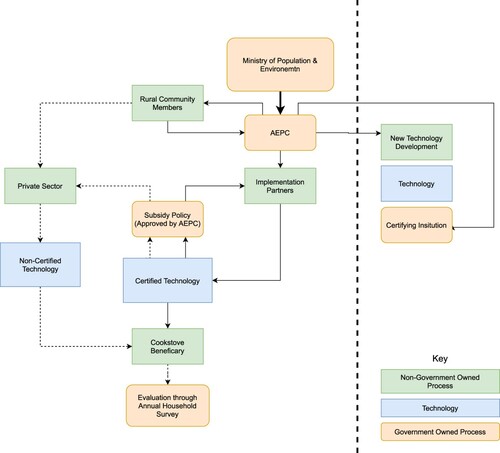
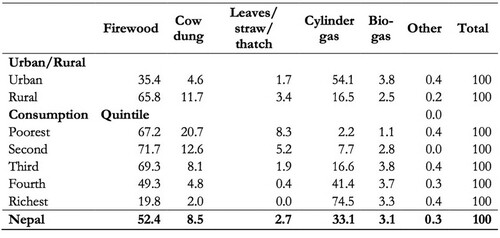
Figure 5. Percentage distribution of households by main fuel used for cooking (National Planning Commission Citation2018).