
Figures & data
Table 1. A working definition of child labour.
Table 2. Three alternative methods of time measurement.
Figure 1. Indian child labour proportion by three measurement methods in 2019 time-use data. Notes: The child labour proportions show range from 4 per cent to 12 per cent, defined as the ratio of the number of children in harmful forms of work (numerator) to (the denominator) the number of children in the population in that age-group. The mean and +/−2 standard errors are displayed. Data source: India Time Use Survey 2019 (NSS Citation2020a).
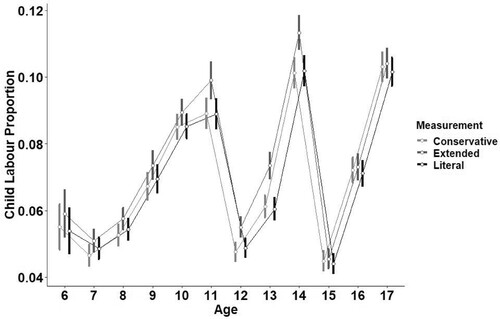
Table 3. Indian child labourer counts using three alternative measurement methods.
Table 4. Labouring hours of child labourers by gender (measured in hours per day).
Figure 2. Histograms of daily working hours by age groups in India 2019 (hours/day). Notes: Our definition of child labour includes those in hazardous work (ILO Citation2017) or overwork; an extended measurement strategy is applied. Data source: India Time Use Survey 2019 (NSS Citation2020a).
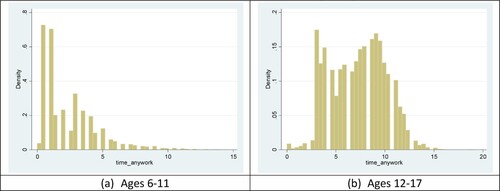
Figure 3. Daily labouring hours of Indian child labourers by gender and age in 2019 (hours/day). Notes: The definition of child labour used here includes those in hazardous work (ILO Citation2017) or overwork (using the time thresholds discussed here); the figure uses the extended measurement strategy. Coverage is ages 6–17. The mean and +/−2 standard errors are displayed. Column (a) reflects both (b) and (c) activities. Data source: India Time Use Survey 2019 (NSS Citation2020a).
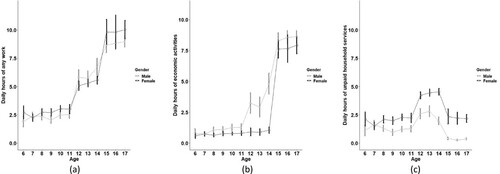
Figure 4. Daily labouring hours of Indian child labourers by gender and social group in 2019. Notes: Using the extended measurement strategy; ages 6–17; mean and +/−2 standard errors are displayed; column (a) reflects both (b) and (c) activities. Data source: India Time Use Survey 2019 (NSS Citation2020a).
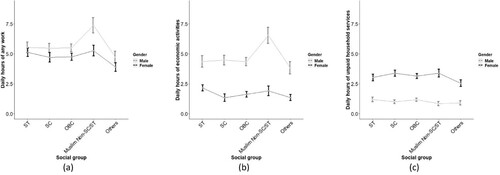
Figure 5. Daily labouring hours of Indian child labourers by gender and the respondent’s dominant type of work in 2019. Notes: Using the extended measurement strategy; ages 6–17; mean and +/−2 standard errors are displayed; column (a) reflects both (b) and (c) activities; a respondent’s dominant type is decided by a respondent’s activity written as usual status. Data source: India Time Use Survey 2019 (NSS Citation2020a).
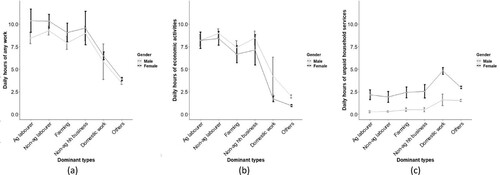
Table A1. A state-level proportion of child labourers by gender.
Table A2. State-level labouring hours of child labourers by dominant types of work.
Table A3. ITUS 2019 case studies.
Data availability statement
Indian Time Use Survey (ITUS) is an open dataset. It is provided through the Ministry of Statistics and Programme Implementation website (https://www.mospi.gov.in/web/mospi/download-tables-data/-/reports/view/templateTwo/24805?q=TBDCAT).