
Figures & data
Figure 1. The number of internal and external integration failures are higher in the early implementation phase.
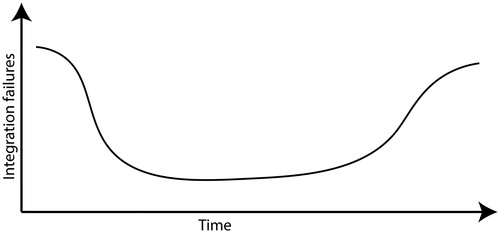
Figure 2. Safe integration influences the acceptance of new innovations or technologies.
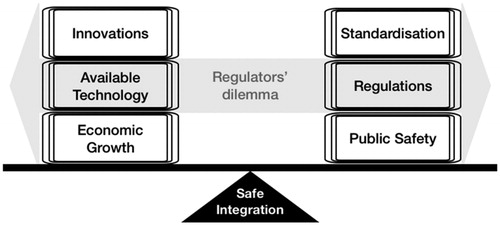
Figure 3. Different levels of integration for passenger transport.
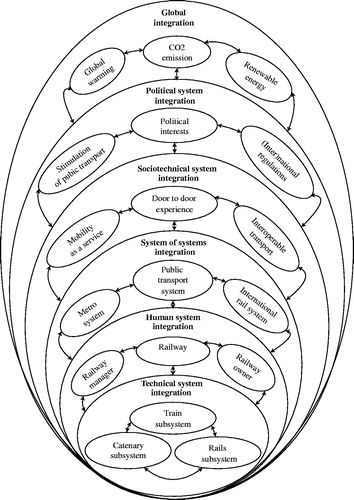
Figure 4. Three different views of the relationship between the human, the system under consideration and the environment. (a) Railway RAMS approach. (b) Systems engineering. (c) Safety management approach.
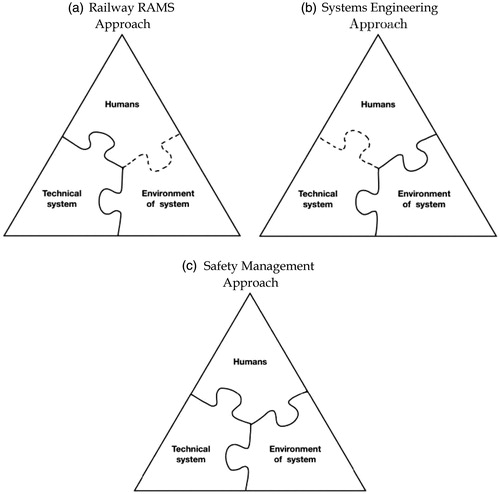
Figure 5. Three different views of the human, the technical system and the environment.
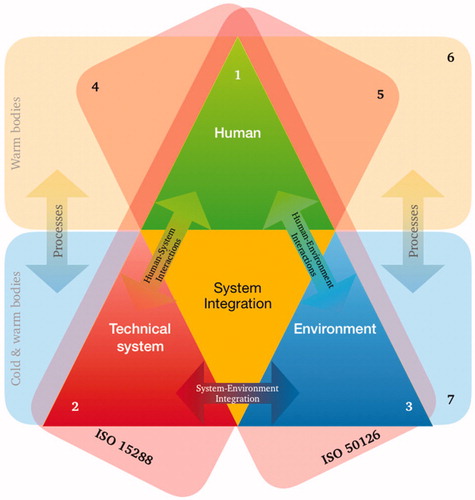
Figure 6. Six sides of the Safety Cube.
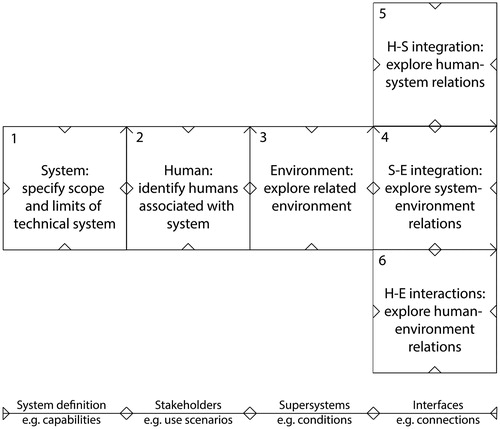
Figure 7. Visualisation of the Safety Cube: six fundamental aspects of safe integration are presented on the six faces of the Safety Cube for Human-System-Environment (HSE).
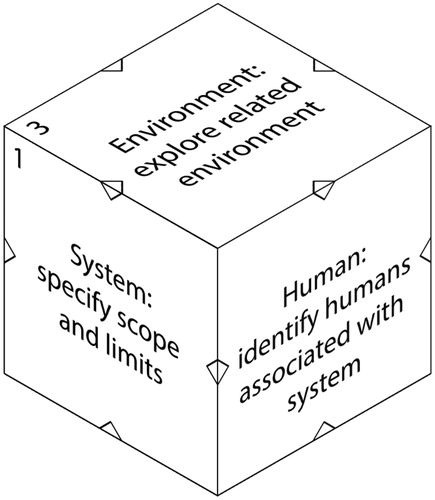
Table 1. The elements of the Safety Cube for safe integration.
Table 2. The fundamental elements of integration across different disciplines.
Figure 8. Visualisation of the Safety Cube for (a) the sociotechnical environment (TSE) and (b) assets, staff, infrastructure (ASI).
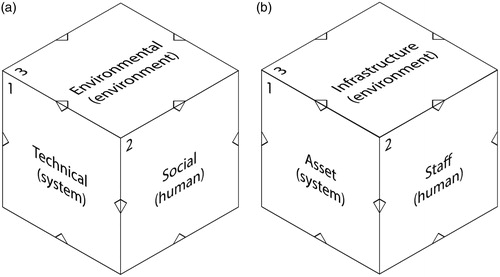
Table 3. The elements of a safety cube for the safe integration of bicycles.
Table 4. Grades of automation (GoA) in automatic train operation (ATO).